Colin
5 December 2022 16:58
1
I updated my laptop yesterday, and after doing so it was painfully slow. I restored it to its pre-update state using snapper and it got its zip back.
I cleared the package cache and updated it again today, and it once again seriously slowed things down, so I have once again restored it.
There was an error during the update:
( 7/22) Creating temporary files...
Failed to write file "/sys/module/pcie_aspm/parameters/policy": Operation not permitted
error: command failed to execute correctly
Could this error be a part of the problem?
System:
  Kernel: 6.0.10-zen2-1-zen arch: x86_64 bits: 64 compiler: gcc v: 12.2.0
    parameters: BOOT_IMAGE=/@/boot/vmlinuz-linux-zen
    root=UUID=e0aa6bf1-e32d-48b2-a659-01e4322f83f8 rw rootflags=subvol=@
    quiet quiet splash rd.udev.log_priority=3 vt.global_cursor_default=0
    resume=UUID=31f5f81c-4fb3-4a39-893a-3e7c25a0feb6 loglevel=3
  Desktop: GNOME v: 43.1 tk: GTK v: 3.24.35 wm: gnome-shell dm: GDM v: 43.0
    Distro: Garuda Linux base: Arch Linux
Machine:
  Type: Laptop System: ASUSTeK product: VivoBook_ASUSLaptop X513UA_M513UA
    v: 1.0 serial: <superuser required>
  Mobo: ASUSTeK model: X513UA v: 1.0 serial: <superuser required>
    UEFI: American Megatrends LLC. v: X513UA.312 date: 04/26/2022
Battery:
  ID-1: BAT0 charge: 15.8 Wh (38.1%) condition: 41.5/42.1 Wh (98.6%)
    volts: 11.8 min: 11.8 model: ASUSTeK ASUS Battery type: Li-ion serial: N/A
    status: discharging cycles: 53
CPU:
  Info: model: AMD Ryzen 5 5500U with Radeon Graphics bits: 64 type: MT MCP
    arch: Zen 2 gen: 3 level: v3 note: check built: 2020-22
    process: TSMC n7 (7nm) family: 0x17 (23) model-id: 0x68 (104) stepping: 1
    microcode: 0x8608103
  Topology: cpus: 1x cores: 6 tpc: 2 threads: 12 smt: enabled cache:
    L1: 384 KiB desc: d-6x32 KiB; i-6x32 KiB L2: 3 MiB desc: 6x512 KiB L3: 8 MiB
    desc: 2x4 MiB
  Speed (MHz): avg: 1399 high: 1400 min/max: 1400/4056 boost: enabled
    scaling: driver: acpi-cpufreq governor: powersave cores: 1: 1397 2: 1400
    3: 1400 4: 1400 5: 1397 6: 1400 7: 1397 8: 1400 9: 1400 10: 1397 11: 1400
    12: 1400 bogomips: 50307
  Flags: avx avx2 ht lm nx pae sse sse2 sse3 sse4_1 sse4_2 sse4a ssse3 svm
  Vulnerabilities:
  Type: itlb_multihit status: Not affected
  Type: l1tf status: Not affected
  Type: mds status: Not affected
  Type: meltdown status: Not affected
  Type: mmio_stale_data status: Not affected
  Type: retbleed mitigation: untrained return thunk; SMT enabled with STIBP
    protection
  Type: spec_store_bypass mitigation: Speculative Store Bypass disabled via
    prctl
  Type: spectre_v1 mitigation: usercopy/swapgs barriers and __user pointer
    sanitization
  Type: spectre_v2 mitigation: Retpolines, IBPB: conditional, STIBP:
    always-on, RSB filling, PBRSB-eIBRS: Not affected
  Type: srbds status: Not affected
  Type: tsx_async_abort status: Not affected
Graphics:
  Device-1: AMD Lucienne vendor: ASUSTeK driver: amdgpu v: kernel
    arch: GCN-5.1 code: Vega-2 process: TSMC n7 (7nm) built: 2018-21 pcie:
    gen: 3 speed: 8 GT/s lanes: 16 link-max: gen: 4 speed: 16 GT/s ports:
    active: eDP-1 empty: HDMI-A-1 bus-ID: 03:00.0 chip-ID: 1002:164c
    class-ID: 0300 temp: 40.0 C
  Device-2: Quanta USB2.0 HD UVC WebCam type: USB driver: uvcvideo
    bus-ID: 3-3:3 chip-ID: 0408:30d4 class-ID: 0e02 serial: <filter>
  Display: x11 server: X.Org v: 21.1.4 with: Xwayland v: 22.1.5
    compositor: gnome-shell driver: X: loaded: amdgpu
    unloaded: modesetting,radeon alternate: fbdev,vesa dri: radeonsi
    gpu: amdgpu display-ID: :0 screens: 1
  Screen-1: 0 s-res: 1920x1080 s-dpi: 96 s-size: 508x285mm (20.00x11.22")
    s-diag: 582mm (22.93")
  Monitor-1: eDP-1 mapped: eDP model: Samsung 0x4161 built: 2020
    res: 1920x1080 hz: 60 dpi: 142 gamma: 1.2 size: 344x194mm (13.54x7.64")
    diag: 395mm (15.5") ratio: 16:9 modes: max: 1920x1080 min: 640x480
  API: OpenGL Message: Unable to show GL data. Required tool glxinfo
    missing.
Audio:
  Device-1: AMD Renoir Radeon High Definition Audio driver: snd_hda_intel
    v: kernel pcie: gen: 3 speed: 8 GT/s lanes: 16 link-max: gen: 4
    speed: 16 GT/s bus-ID: 03:00.1 chip-ID: 1002:1637 class-ID: 0403
  Device-2: AMD ACP/ACP3X/ACP6x Audio Coprocessor vendor: ASUSTeK
    driver: N/A alternate: snd_pci_acp3x, snd_rn_pci_acp3x, snd_pci_acp5x,
    snd_pci_acp6x, snd_acp_pci, snd_rpl_pci_acp6x, snd_sof_amd_renoir pcie:
    gen: 3 speed: 8 GT/s lanes: 16 link-max: gen: 4 speed: 16 GT/s
    bus-ID: 03:00.5 chip-ID: 1022:15e2 class-ID: 0480
  Device-3: AMD Family 17h/19h HD Audio vendor: ASUSTeK
    driver: snd_hda_intel v: kernel pcie: gen: 3 speed: 8 GT/s lanes: 16
    link-max: gen: 4 speed: 16 GT/s bus-ID: 03:00.6 chip-ID: 1022:15e3
    class-ID: 0403
  Sound API: ALSA v: k6.0.10-zen2-1-zen running: yes
  Sound Server-1: PulseAudio v: 16.1 running: no
  Sound Server-2: PipeWire v: 0.3.61 running: yes
Network:
  Device-1: Intel Wi-Fi 6 AX210/AX211/AX411 160MHz driver: iwlwifi v: kernel
    pcie: gen: 2 speed: 5 GT/s lanes: 1 bus-ID: 01:00.0 chip-ID: 8086:2725
    class-ID: 0280
  IF: wlp1s0 state: down mac: <filter>
  Device-2: ZTE WCDMA MSM DEMO Mobile Boardband type: USB
    driver: cdc_ether,usb-storage bus-ID: 1-3:2 chip-ID: 19d2:1405
    class-ID: 0806 serial: <filter>
  IF: enp3s0f3u3 state: up speed: 150 Mbps duplex: half mac: <filter>
Bluetooth:
  Device-1: Intel AX210 Bluetooth type: USB driver: btusb v: 0.8 bus-ID: 3-2:2
    chip-ID: 8087:0032 class-ID: e001
  Report: bt-adapter ID: hci0 rfk-id: 2 state: up address: <filter>
Drives:
  Local Storage: total: 476.94 GiB used: 13.25 GiB (2.8%)
  SMART Message: Required tool smartctl not installed. Check --recommends
  ID-1: /dev/nvme0n1 maj-min: 259:0 vendor: Samsung
    model: MZVLQ512HALU-00000 size: 476.94 GiB block-size: physical: 512 B
    logical: 512 B speed: 31.6 Gb/s lanes: 4 type: SSD serial: <filter>
    rev: FXV7101Q temp: 31.9 C scheme: GPT
Partition:
  ID-1: / raw-size: 146.49 GiB size: 146.49 GiB (100.00%)
    used: 10.56 GiB (7.2%) fs: btrfs dev: /dev/nvme0n1p2 maj-min: 259:2
  ID-2: /boot/efi raw-size: 1024 MiB size: 1022 MiB (99.80%)
    used: 608 KiB (0.1%) fs: vfat dev: /dev/nvme0n1p1 maj-min: 259:1
  ID-3: /home raw-size: 321.45 GiB size: 321.45 GiB (100.00%)
    used: 2.7 GiB (0.8%) fs: btrfs dev: /dev/nvme0n1p4 maj-min: 259:4
  ID-4: /var/log raw-size: 146.49 GiB size: 146.49 GiB (100.00%)
    used: 10.56 GiB (7.2%) fs: btrfs dev: /dev/nvme0n1p2 maj-min: 259:2
  ID-5: /var/tmp raw-size: 146.49 GiB size: 146.49 GiB (100.00%)
    used: 10.56 GiB (7.2%) fs: btrfs dev: /dev/nvme0n1p2 maj-min: 259:2
Swap:
  Kernel: swappiness: 133 (default 60) cache-pressure: 100 (default)
  ID-1: swap-1 type: partition size: 8 GiB used: 0 KiB (0.0%) priority: -2
    dev: /dev/nvme0n1p3 maj-min: 259:3
  ID-2: swap-2 type: zram size: 7.15 GiB used: 0 KiB (0.0%) priority: 100
    dev: /dev/zram0
Sensors:
  System Temperatures: cpu: 40.9 C mobo: N/A gpu: amdgpu temp: 40.0 C
  Fan Speeds (RPM): cpu: 0
Info:
  Processes: 368 Uptime: 2m wakeups: 1 Memory: 7.15 GiB used: 2.28 GiB (31.8%)
  Init: systemd v: 252 default: graphical tool: systemctl Compilers:
  gcc: 12.2.0 Packages: pm: pacman pkgs: 1198 libs: 331 tools: pamac,paru
  Shell: fish v: 3.5.1 default: Bash v: 5.1.16 running-in: gnome-terminal
  inxi: 3.3.23
Garuda (2.6.10-1):
  System install date:     2022-12-01
  Last full system update: 2022-12-02
  Is partially upgraded:   No
  Relevant software:       NetworkManager
  Windows dual boot:       No/Undetected
  Snapshots:               Snapper
  Failed units:
1 Like
tbg
5 December 2022 17:07
2
After a very large update, if you experience a slowdown try running a btrfs balance operation. Be sure to reboot after a balancing operation.
Have you searched for the error on the forum? I’m sure there are more than one answers to this question already @Colin .
3 Likes
filo
5 December 2022 17:20
3
You could also use htop or something like that to check which application is using most of your resources.
2 Likes
Colin
5 December 2022 18:10
4
Thanks for the info.
I’ll look into this and give it a try.
After looking around I think this error is not related to the issue.
I get this error every now and then during kernel updates, ever since I have install Garuda.
Is this normal? Is there a solution to this
The slow down is universal from boot up to shut down.
Colin
5 December 2022 18:33
5
I found details about btrfs balance at
I entered…
bash -c "sudo btrfs balance start -musage=60 -dusage=60 / & sudo watch -t -n5 btrfs balance status / && fg"
…at the terminal, and this has been displayed…
No balance found on '/'
…it strikes me that I’ve got something wrong.
tbg
5 December 2022 18:58
6
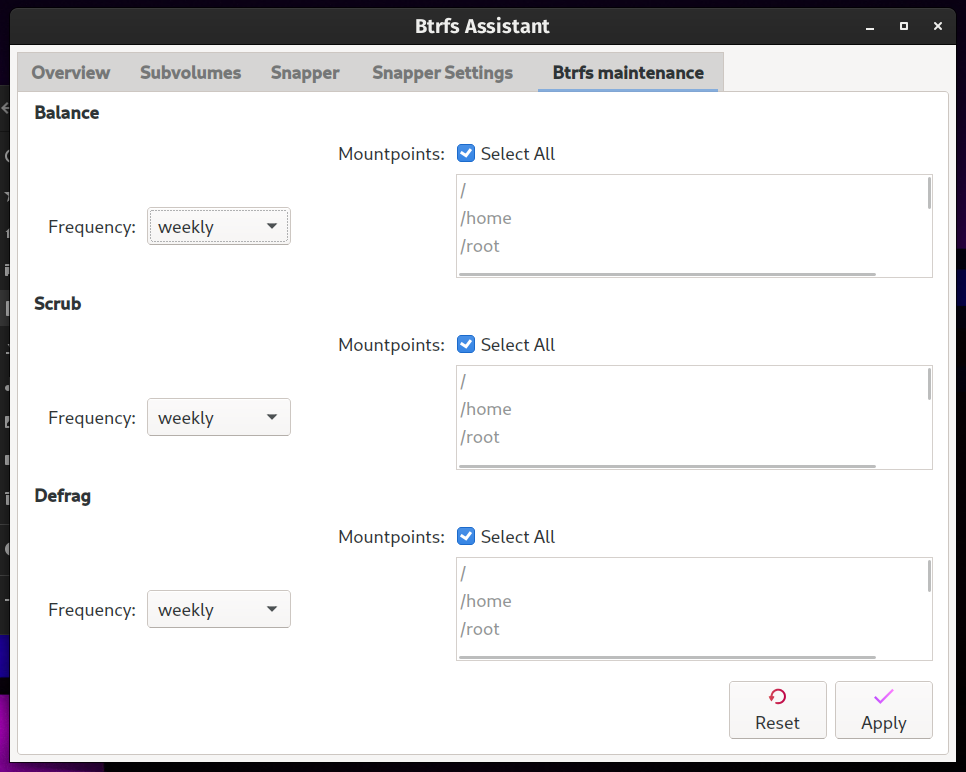
You can perform balance through the Garuda Assistant utility.
1 Like
Colin
5 December 2022 19:10
7
I've found the balance utility on the BTRFS Assistant...
...I'll set the frequency briefly to daily. It will then hopefully be done sometime tomorrow.
tbg
5 December 2022 22:34
8
Just a word of caution, you should never interrupt a balancing operation while it is in progress.
Colin
5 December 2022 22:49
9
Is there any way to tell when it's being done?
tbg
6 December 2022 01:25
10
Not sure if the command below will work after the balance has already been initiated:
sudo watch -t -n5 btrfs balance status
I'm only on my phone so I can't verify that command , but give it a try.
Otherwise, if you have an activity light that keeps flashing you'll know its still likely chugging away
2 Likes
To run it manually I use "Btrfs Assistant">Overview tab> bottom right "Balance" section> click start. It will show you the progress and the percent of chunks left.
1 Like
filo
6 December 2022 07:36
12
In the hopefully remote event that the balance does not start at all, check the journal.
4 Likes
Colin
6 December 2022 15:48
13
Thanks for the additional replies.
I used the following to perform the balancing operation…
…thanks for this info.
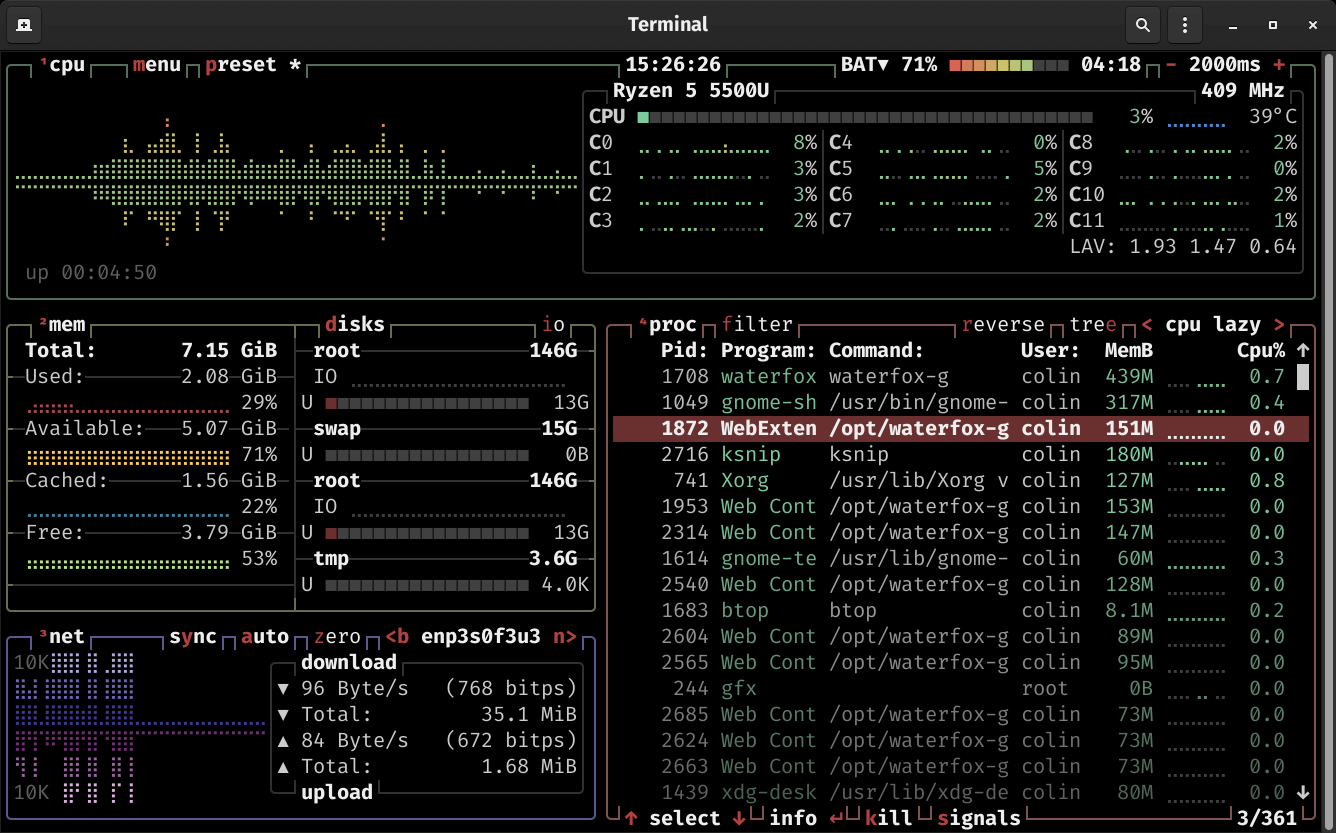
I still found my system wasn’t as snappy after the update as it was prior to it. It was only when I opened up btop that the reason became clear.
Prior to the update my CPU idled at 1400MHz. After the update my CPU is idling at 400MHz, and its maximum speed is 409MHz.
I’m baffled.
System:
  Kernel: 6.0.11-zen1-1-zen arch: x86_64 bits: 64 compiler: gcc v: 12.2.0
    parameters: BOOT_IMAGE=/@/boot/vmlinuz-linux-zen root=UUID=e0aa6bf1-e32d-48b2-a659-01e4322f83f8
    rw rootflags=subvol=@ quiet quiet splash rd.udev.log_priority=3 vt.global_cursor_default=0
    resume=UUID=31f5f81c-4fb3-4a39-893a-3e7c25a0feb6 loglevel=3
  Desktop: GNOME v: 43.1 tk: GTK v: 3.24.35 wm: gnome-shell dm: GDM v: 43.0 Distro: Garuda Linux
    base: Arch Linux
Machine:
  Type: Laptop System: ASUSTeK product: VivoBook_ASUSLaptop X513UA_M513UA v: 1.0
    serial: <superuser required>
  Mobo: ASUSTeK model: X513UA v: 1.0 serial: <superuser required> UEFI: American Megatrends LLC.
    v: X513UA.312 date: 04/26/2022
Battery:
  ID-1: BAT0 charge: 27.6 Wh (66.5%) condition: 41.5/42.1 Wh (98.6%) volts: 11.8 min: 11.8
    model: ASUSTeK ASUS Battery type: Li-ion serial: N/A status: discharging cycles: 55
CPU:
  Info: model: AMD Ryzen 5 5500U with Radeon Graphics bits: 64 type: MT MCP arch: Zen 2 gen: 3
    level: v3 note: check built: 2020-22 process: TSMC n7 (7nm) family: 0x17 (23)
    model-id: 0x68 (104) stepping: 1 microcode: 0x8608103
  Topology: cpus: 1x cores: 6 tpc: 2 threads: 12 smt: enabled cache: L1: 384 KiB
    desc: d-6x32 KiB; i-6x32 KiB L2: 3 MiB desc: 6x512 KiB L3: 8 MiB desc: 2x4 MiB
  Speed (MHz): avg: 406 high: 409 min/max: 400/4056 boost: enabled scaling: driver: amd-pstate
    governor: powersave cores: 1: 409 2: 409 3: 409 4: 409 5: 409 6: 409 7: 400 8: 400 9: 409 10: 400
    11: 409 12: 409 bogomips: 50301
  Flags: avx avx2 ht lm nx pae sse sse2 sse3 sse4_1 sse4_2 sse4a ssse3 svm
  Vulnerabilities:
  Type: itlb_multihit status: Not affected
  Type: l1tf status: Not affected
  Type: mds status: Not affected
  Type: meltdown status: Not affected
  Type: mmio_stale_data status: Not affected
  Type: retbleed mitigation: untrained return thunk; SMT enabled with STIBP protection
  Type: spec_store_bypass mitigation: Speculative Store Bypass disabled via prctl
  Type: spectre_v1 mitigation: usercopy/swapgs barriers and __user pointer sanitization
  Type: spectre_v2 mitigation: Retpolines, IBPB: conditional, STIBP: always-on, RSB filling,
    PBRSB-eIBRS: Not affected
  Type: srbds status: Not affected
  Type: tsx_async_abort status: Not affected
Graphics:
  Device-1: AMD Lucienne vendor: ASUSTeK driver: amdgpu v: kernel arch: GCN-5.1 code: Vega-2
    process: TSMC n7 (7nm) built: 2018-21 pcie: gen: 3 speed: 8 GT/s lanes: 16 link-max: gen: 4
    speed: 16 GT/s ports: active: eDP-1 empty: HDMI-A-1 bus-ID: 03:00.0 chip-ID: 1002:164c
    class-ID: 0300 temp: 41.0 C
  Device-2: Quanta USB2.0 HD UVC WebCam type: USB driver: uvcvideo bus-ID: 3-3:3
    chip-ID: 0408:30d4 class-ID: 0e02 serial: <filter>
  Display: x11 server: X.Org v: 21.1.4 with: Xwayland v: 22.1.5 compositor: gnome-shell driver:
    X: loaded: amdgpu unloaded: modesetting,radeon alternate: fbdev,vesa dri: radeonsi gpu: amdgpu
    display-ID: :0 screens: 1
  Screen-1: 0 s-res: 1920x1080 s-dpi: 96 s-size: 508x285mm (20.00x11.22") s-diag: 582mm (22.93")
  Monitor-1: eDP-1 mapped: eDP model: Samsung 0x4161 built: 2020 res: 1920x1080 hz: 60 dpi: 142
    gamma: 1.2 size: 344x194mm (13.54x7.64") diag: 395mm (15.5") ratio: 16:9 modes: max: 1920x1080
    min: 640x480
  API: OpenGL Message: Unable to show GL data. Required tool glxinfo missing.
Audio:
  Device-1: AMD Renoir Radeon High Definition Audio driver: snd_hda_intel v: kernel pcie: gen: 3
    speed: 8 GT/s lanes: 16 link-max: gen: 4 speed: 16 GT/s bus-ID: 03:00.1 chip-ID: 1002:1637
    class-ID: 0403
  Device-2: AMD ACP/ACP3X/ACP6x Audio Coprocessor vendor: ASUSTeK driver: N/A
    alternate: snd_pci_acp3x, snd_rn_pci_acp3x, snd_pci_acp5x, snd_pci_acp6x, snd_acp_pci,
    snd_rpl_pci_acp6x, snd_sof_amd_renoir pcie: gen: 3 speed: 8 GT/s lanes: 16 link-max: gen: 4
    speed: 16 GT/s bus-ID: 03:00.5 chip-ID: 1022:15e2 class-ID: 0480
  Device-3: AMD Family 17h/19h HD Audio vendor: ASUSTeK driver: snd_hda_intel v: kernel pcie:
    gen: 3 speed: 8 GT/s lanes: 16 link-max: gen: 4 speed: 16 GT/s bus-ID: 03:00.6 chip-ID: 1022:15e3
    class-ID: 0403
  Sound API: ALSA v: k6.0.11-zen1-1-zen running: yes
  Sound Server-1: PulseAudio v: 16.1 running: no
  Sound Server-2: PipeWire v: 0.3.61 running: yes
Network:
  Device-1: Intel Wi-Fi 6 AX210/AX211/AX411 160MHz driver: iwlwifi v: kernel pcie: gen: 2
    speed: 5 GT/s lanes: 1 bus-ID: 01:00.0 chip-ID: 8086:2725 class-ID: 0280
  IF: wlp1s0 state: down mac: <filter>
  Device-2: ZTE WCDMA MSM DEMO Mobile Boardband type: USB driver: cdc_ether,usb-storage
    bus-ID: 1-3:2 chip-ID: 19d2:1405 class-ID: 0806 serial: <filter>
  IF: enp3s0f3u3 state: up speed: 150 Mbps duplex: half mac: <filter>
Bluetooth:
  Device-1: Intel AX210 Bluetooth type: USB driver: btusb v: 0.8 bus-ID: 3-2:2 chip-ID: 8087:0032
    class-ID: e001
  Report: bt-adapter ID: hci0 rfk-id: 2 state: up address: <filter>
Drives:
  Local Storage: total: 476.94 GiB used: 13.45 GiB (2.8%)
  SMART Message: Required tool smartctl not installed. Check --recommends
  ID-1: /dev/nvme0n1 maj-min: 259:0 vendor: Samsung model: MZVLQ512HALU-00000 size: 476.94 GiB
    block-size: physical: 512 B logical: 512 B speed: 31.6 Gb/s lanes: 4 type: SSD serial: <filter>
    rev: FXV7101Q temp: 36.9 C scheme: GPT
Partition:
  ID-1: / raw-size: 146.49 GiB size: 146.49 GiB (100.00%) used: 10.75 GiB (7.3%) fs: btrfs
    dev: /dev/nvme0n1p2 maj-min: 259:2
  ID-2: /boot/efi raw-size: 1024 MiB size: 1022 MiB (99.80%) used: 608 KiB (0.1%) fs: vfat
    dev: /dev/nvme0n1p1 maj-min: 259:1
  ID-3: /home raw-size: 321.45 GiB size: 321.45 GiB (100.00%) used: 2.7 GiB (0.8%) fs: btrfs
    dev: /dev/nvme0n1p4 maj-min: 259:4
  ID-4: /var/log raw-size: 146.49 GiB size: 146.49 GiB (100.00%) used: 10.75 GiB (7.3%) fs: btrfs
    dev: /dev/nvme0n1p2 maj-min: 259:2
  ID-5: /var/tmp raw-size: 146.49 GiB size: 146.49 GiB (100.00%) used: 10.75 GiB (7.3%) fs: btrfs
    dev: /dev/nvme0n1p2 maj-min: 259:2
Swap:
  Kernel: swappiness: 133 (default 60) cache-pressure: 100 (default)
  ID-1: swap-1 type: zram size: 7.15 GiB used: 0 KiB (0.0%) priority: 100 dev: /dev/zram0
  ID-2: swap-2 type: partition size: 8 GiB used: 0 KiB (0.0%) priority: -2 dev: /dev/nvme0n1p3
    maj-min: 259:3
Sensors:
  System Temperatures: cpu: 42.0 C mobo: N/A gpu: amdgpu temp: 40.0 C
  Fan Speeds (RPM): cpu: 0
Info:
  Processes: 360 Uptime: 23m wakeups: 1 Memory: 7.15 GiB used: 2.91 GiB (40.7%) Init: systemd
  v: 252 default: graphical tool: systemctl Compilers: gcc: 12.2.0 Packages: pm: pacman pkgs: 1198
  libs: 331 tools: pamac,paru Client: shell wrapper v: 5.1.16-release inxi: 3.3.23
Garuda (2.6.10-1):
  System install date:     2022-12-05
  Last full system update: 2022-12-06
  Is partially upgraded:   No
  Relevant software:       NetworkManager
  Windows dual boot:       No/Undetected
  Snapshots:               Snapper
  Failed units:
filo
6 December 2022 17:00
14
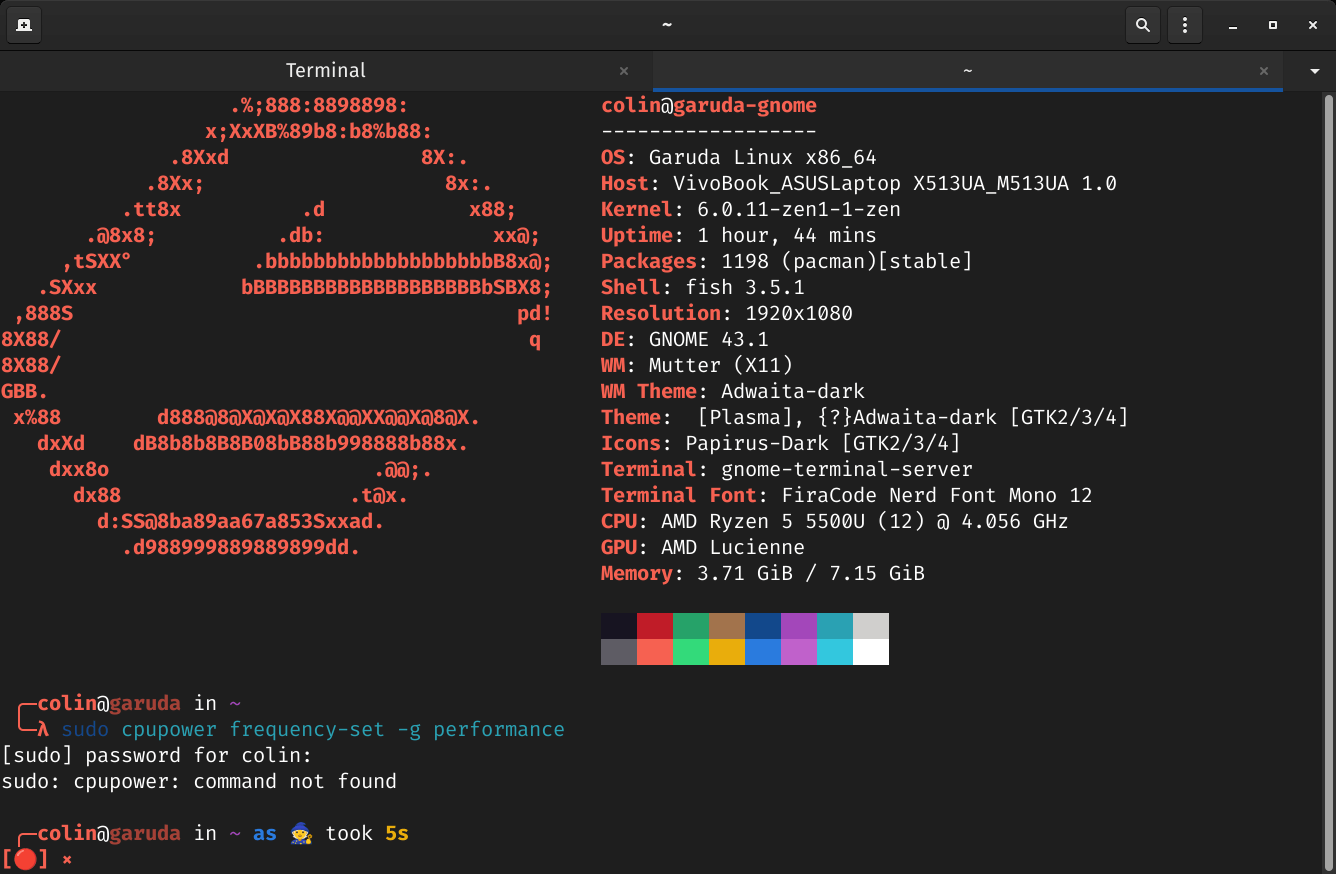
Something must have changed in a recent update for the amd-pstate or the governor.
sudo cpupower frequency-set -g performance
2 Likes
SGS
6 December 2022 17:19
16
Please, no pictures from terminal.
filo
6 December 2022 17:27
17
You can install it
sudo pacman -Syu cpupower
Check what you have in the Garuda Assistant.
1 Like
1 Like
Colin
6 December 2022 19:12
19
I had a look on YouTube to get some info on auto-cpufreq. I was somewhat dubious about using it as Gnome has its own power settings, but it seemed obvious they were having no effect.
I had a look at this video by the author of auto-cpufreq...
...and after doing so I installed auto-cpufreq via Garuda Assistant > Settings > Powersave Tweaks and then enabled it.
The first thing I noticed was the Gnome power settings had disappeared from its drop menu.
I then found that when the power cable is not inserted into my laptop its CPU frequency is 400MHz, and when it is inserted the CPU frequency increases to 2.1GHz.
Prior to the kernel update the CPU frequency was always 1.4GHz at idle regardless of whether the laptop was plugged in or not, so I guess some changes regarding power usage have been made in this kernel update.
Thanks for pointing me in the direction of auto-cpufreq. It has resolved the issue (and my battery should now also last a bit longer).
1 Like
Colin
6 December 2022 19:44
20
As a footnote, after a reboot I had a problem. Here's the terminal output::
auto-cpufreq --stats
Note: You can quit stats mode by pressing "ctrl+c"
----------------------------------- Warning -----------------------------------
Detected running GNOME Power Profiles daemon service!
This daemon might interfere with auto-cpufreq and should be disabled.
Steps to perform this action using auto-cpufreq: power_helper script:
git clone https://github.com/AdnanHodzic/auto-cpufreq.git
cd auto-cpufreq/auto_cpufreq
python3 power_helper.py --gnome_power_disable
Reference: https://github.com/AdnanHodzic/auto-cpufreq#configuring-auto-cpufreq
----------------------------- auto-cpufreq stats ------------------------------
ERROR: auto-cpufreq stats are missing.
Make sure to run: "auto-cpufreq --install" first
-------------------------------------------------------------------------------
╭─colin@garuda in ~ took 1s
╰─λ git clone https://github.com/AdnanHodzic/auto-cpufreq.git
Cloning into 'auto-cpufreq'...
remote: Enumerating objects: 1747, done.
remote: Counting objects: 100% (458/458), done.
remote: Compressing objects: 100% (165/165), done.
remote: Total 1747 (delta 354), reused 330 (delta 288), pack-reused 1289
Receiving objects: 100% (1747/1747), 360.30 KiB | 1.68 MiB/s, done.
Resolving deltas: 100% (901/901), done.
╭─colin@garuda in ~ took 1s
╰─λ cd auto-cpufreq/auto_cpufreq
╭─colin@garuda in repo: auto-cpufreq/auto_cpufreq on master via v3.10.8 took 3ms
╰─λ python3 power_helper.py --gnome_power_disable
Error: Option '--gnome_power_disable' requires an argument.
Can anyone tell me what I'm missing?
")