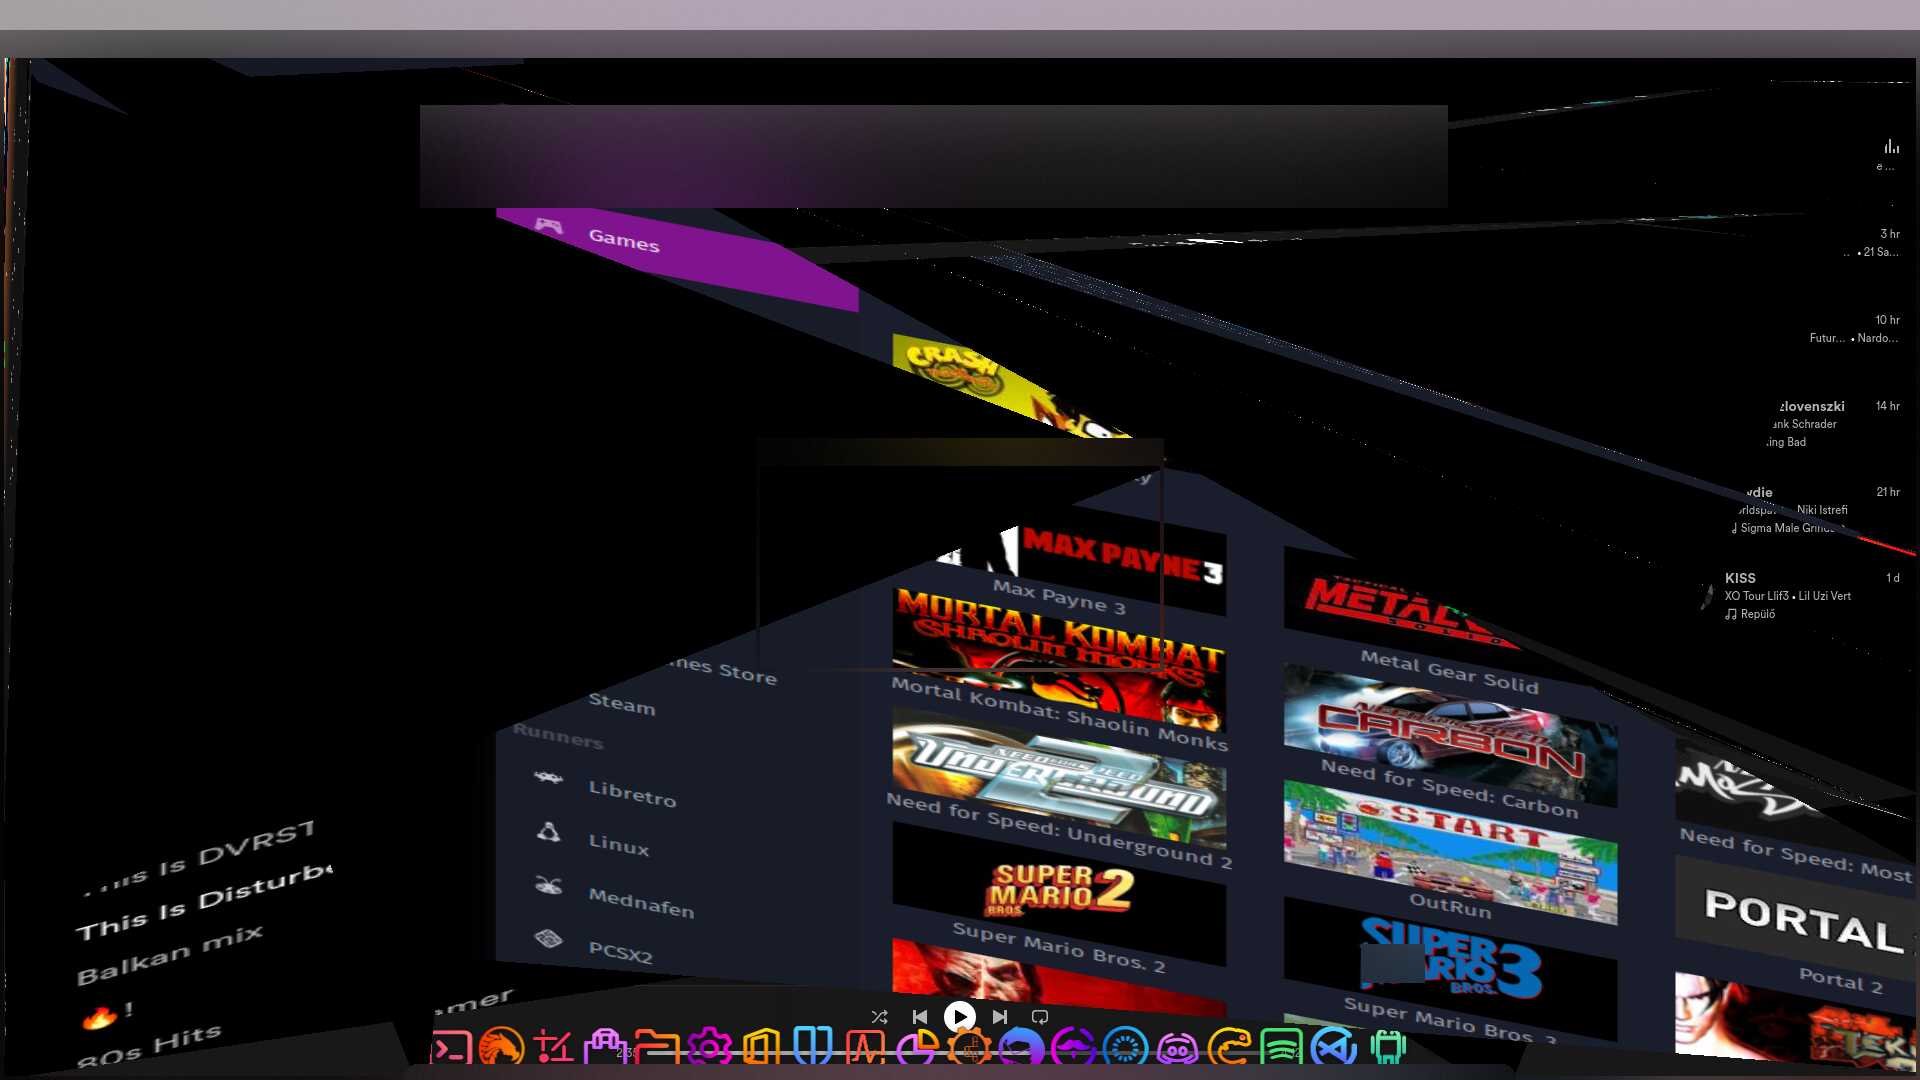
Hello, I've been using garuda since january, and this is the 3rd time this happened. First time, it was while listening to music, all windows started glitching out and deforming and ended up like the picture, afterwards, a restart helped. It happened 2 more times, windows were glitching and deforming and ended up like on the picture.
I don't know if it's the Plasma desktop, or Kwin, I don't know where to start.. Any ideas?
(Other than this (and dolphin+Ktorrent freezing and crashing here and there), I am really satisfied with garuda, really good job guys!)

inxi
System:
Kernel: 5.16.12-zen1-1-zen x86_64 bits: 64 compiler: gcc v: 11.2.0
parameters: BOOT_IMAGE=/@/boot/vmlinuz-linux-zen
root=UUID=6f02cca7-346f-4cd7-8573-fa3f1c3a3cf3 rw rootflags=subvol=@
quiet splash rd.udev.log_priority=3 vt.global_cursor_default=0
resume=UUID=513821c1-bd0a-4c2c-aa9d-b602dc89905d loglevel=3
Desktop: KDE Plasma 5.24.2 tk: Qt 5.15.2 info: latte-dock wm: kwin_x11
vt: 1 dm: SDDM Distro: Garuda Linux base: Arch Linux
Machine:
Type: Laptop System: ASUSTeK product: ROG Strix G531GU_G531GU v: 1.0
serial: <superuser required>
Mobo: ASUSTeK model: G531GU v: 1.0 serial: <superuser required>
UEFI: American Megatrends v: G531GU.311 date: 02/19/2021
Battery:
ID-1: BAT0 charge: 52.1 Wh (100.0%) condition: 52.1/66.0 Wh (78.9%)
volts: 15.7 min: 15.7 model: ASUSTeK ASUS Battery type: Li-ion serial: N/A
status: Not charging
CPU:
Info: model: Intel Core i7-9750H bits: 64 type: MT MCP arch: Coffee Lake
family: 6 model-id: 0x9E (158) stepping: 0xA (10) microcode: 0xEC
Topology: cpus: 1x cores: 6 tpc: 2 threads: 12 smt: enabled cache:
L1: 384 KiB desc: d-6x32 KiB; i-6x32 KiB L2: 1.5 MiB desc: 6x256 KiB
L3: 12 MiB desc: 1x12 MiB
Speed (MHz): avg: 800 min/max: 800/4500 scaling: driver: intel_pstate
governor: powersave cores: 1: 800 2: 800 3: 800 4: 800 5: 800 6: 800 7: 800
8: 800 9: 800 10: 800 11: 800 12: 800 bogomips: 62399
Flags: avx avx2 ht lm nx pae sse sse2 sse3 sse4_1 sse4_2 ssse3 vmx
Vulnerabilities:
Type: itlb_multihit status: KVM: VMX disabled
Type: l1tf
mitigation: PTE Inversion; VMX: conditional cache flushes, SMT vulnerable
Type: mds mitigation: Clear CPU buffers; SMT vulnerable
Type: meltdown mitigation: PTI
Type: spec_store_bypass
mitigation: Speculative Store Bypass disabled via prctl
Type: spectre_v1
mitigation: usercopy/swapgs barriers and __user pointer sanitization
Type: spectre_v2 mitigation: Full generic retpoline, IBPB: conditional,
IBRS_FW, STIBP: conditional, RSB filling
Type: srbds mitigation: Microcode
Type: tsx_async_abort status: Not affected
Graphics:
Device-1: Intel CoffeeLake-H GT2 [UHD Graphics 630] vendor: ASUSTeK
driver: i915 v: kernel ports: active: eDP-1 empty: none bus-ID: 00:02.0
chip-ID: 8086:3e9b class-ID: 0300
Device-2: NVIDIA TU116M [GeForce GTX 1660 Ti Mobile] vendor: ASUSTeK
driver: nvidia v: 510.54 alternate: nouveau,nvidia_drm pcie: gen: 3
speed: 8 GT/s lanes: 8 link-max: lanes: 16 ports: active: none
empty: DP-1,HDMI-A-1 bus-ID: 01:00.0 chip-ID: 10de:2191 class-ID: 0300
Display: x11 server: X.Org v: 1.21.1.3 compositor: kwin_x11 driver: X:
loaded: modesetting,nvidia gpu: i915 display-ID: :0 screens: 1
Screen-1: 0 s-res: 1920x1080 s-dpi: 96 s-size: 508x285mm (20.0x11.2")
s-diag: 582mm (22.9")
Monitor-1: eDP-1-1 mapped: eDP-1 built: 2018 res: 1920x1080 hz: 120
dpi: 142 gamma: 1.2 size: 344x194mm (13.5x7.6") diag: 395mm (15.5")
ratio: 16:9 modes: 1920x1080
OpenGL: renderer: NVIDIA GeForce GTX 1660 Ti/PCIe/SSE2
v: 4.6.0 NVIDIA 510.54 direct render: Yes
Audio:
Device-1: Intel Cannon Lake PCH cAVS vendor: ASUSTeK driver: snd_hda_intel
v: kernel alternate: snd_soc_skl,snd_sof_pci_intel_cnl bus-ID: 00:1f.3
chip-ID: 8086:a348 class-ID: 0403
Device-2: NVIDIA TU116 High Definition Audio vendor: ASUSTeK
driver: snd_hda_intel v: kernel pcie: gen: 3 speed: 8 GT/s lanes: 8
link-max: lanes: 16 bus-ID: 01:00.1 chip-ID: 10de:1aeb class-ID: 0403
Device-3: Sony Wireless Headset type: USB
driver: hid-generic,snd-usb-audio,usbhid bus-ID: 1-3:5 chip-ID: 054c:0d5e
class-ID: 0300
Sound Server-1: ALSA v: k5.16.12-zen1-1-zen running: yes
Sound Server-2: PulseAudio v: 15.0 running: no
Sound Server-3: PipeWire v: 0.3.48 running: yes
Network:
Device-1: Intel Cannon Lake PCH CNVi WiFi driver: iwlwifi v: kernel
bus-ID: 00:14.3 chip-ID: 8086:a370 class-ID: 0280
IF: wlo1 state: up mac: <filter>
Device-2: Realtek RTL8111/8168/8411 PCI Express Gigabit Ethernet
vendor: ASUSTeK driver: r8169 v: kernel pcie: gen: 1 speed: 2.5 GT/s
lanes: 1 port: 3000 bus-ID: 03:00.0 chip-ID: 10ec:8168 class-ID: 0200
IF: eno2 state: down mac: <filter>
Device-3: Sony Wireless Headset type: USB
driver: hid-generic,snd-usb-audio,usbhid bus-ID: 1-3:5 chip-ID: 054c:0d5e
class-ID: 0300
IF-ID-1: anbox0 state: down mac: <filter>
Bluetooth:
Device-1: Intel Bluetooth 9460/9560 Jefferson Peak (JfP) type: USB
driver: btusb v: 0.8 bus-ID: 1-14:4 chip-ID: 8087:0aaa class-ID: e001
Report: bt-adapter ID: hci0 rfk-id: 0 state: up address: <filter>
Drives:
Local Storage: total: 1.38 TiB used: 1010.73 GiB (71.8%)
SMART Message: Unable to run smartctl. Root privileges required.
ID-1: /dev/nvme0n1 maj-min: 259:0 vendor: Intel model: SSDPEKNW512G8
size: 476.94 GiB block-size: physical: 512 B logical: 512 B
speed: 31.6 Gb/s lanes: 4 type: SSD serial: <filter> rev: 002C
temp: 28.9 C scheme: GPT
ID-2: /dev/sda maj-min: 8:0 vendor: Seagate model: ST1000LM024 HN-M101MBB
size: 931.51 GiB block-size: physical: 4096 B logical: 512 B
speed: 6.0 Gb/s type: HDD rpm: 5400 serial: <filter> rev: 0001
scheme: GPT
Partition:
ID-1: / raw-size: 459.62 GiB size: 459.62 GiB (100.00%)
used: 284.89 GiB (62.0%) fs: btrfs dev: /dev/nvme0n1p2 maj-min: 259:2
ID-2: /boot/efi raw-size: 300 MiB size: 299.4 MiB (99.80%)
used: 576 KiB (0.2%) fs: vfat dev: /dev/nvme0n1p1 maj-min: 259:1
ID-3: /home raw-size: 459.62 GiB size: 459.62 GiB (100.00%)
used: 284.89 GiB (62.0%) fs: btrfs dev: /dev/nvme0n1p2 maj-min: 259:2
ID-4: /var/log raw-size: 459.62 GiB size: 459.62 GiB (100.00%)
used: 284.89 GiB (62.0%) fs: btrfs dev: /dev/nvme0n1p2 maj-min: 259:2
ID-5: /var/tmp raw-size: 459.62 GiB size: 459.62 GiB (100.00%)
used: 284.89 GiB (62.0%) fs: btrfs dev: /dev/nvme0n1p2 maj-min: 259:2
Swap:
Kernel: swappiness: 133 (default 60) cache-pressure: 100 (default)
ID-1: swap-1 type: partition size: 17.02 GiB used: 0 KiB (0.0%)
priority: -2 dev: /dev/nvme0n1p3 maj-min: 259:3
ID-2: swap-2 type: zram size: 15.48 GiB used: 26.8 MiB (0.2%)
priority: 100 dev: /dev/zram0
Sensors:
System Temperatures: cpu: 49.0 C pch: 53.0 C mobo: N/A gpu: nvidia
temp: 49 C
Fan Speeds (RPM): cpu: 3800
Info:
Processes: 408 Uptime: 1h 55m wakeups: 1 Memory: 15.48 GiB
used: 8.1 GiB (52.3%) Init: systemd v: 250 tool: systemctl Compilers:
gcc: 11.2.0 clang: 13.0.1 Packages: pacman: 1939 lib: 535 Shell: fish
v: 3.3.1 default: Bash v: 5.1.16 running-in: konsole inxi: 3.3.13
Garuda (2.5.5-1):
System install date:     2022-03-01
Last full system update: 2022-03-05
Is partially upgraded:   No
Relevant software:       NetworkManager
Windows dual boot:       Probably (Run as root to verify)
Snapshots:               Snapper
Failed units:            systemd-networkd-wait-online.service