Periodically when I open Konsole the primary screen will go black (mouse still moves and changes to various types (hands, i-beam, etc) when I hover over where screen elements would be, but it is just black under the mouse cursor. Connected monitor is fine. Attempting to log out & back in results in a spinning dragon logo. I have to restart to get it to work again. Most of the time I notice it happens after being delayed before displaying GPU names (not sure if it is related to that).
Happens on 5.18 & 5.19 for roughly the past week.
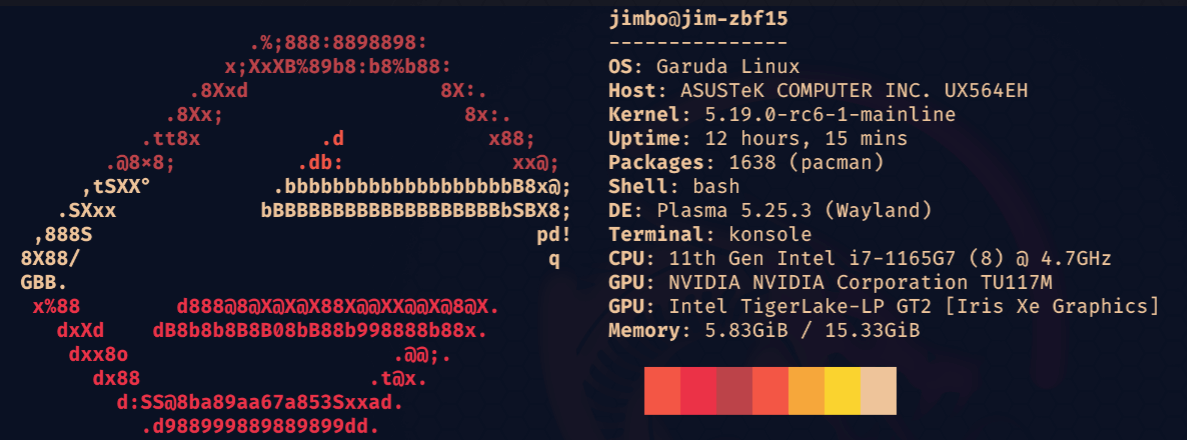
System:
  Kernel: 5.19.0-rc6-1-mainline arch: x86_64 bits: 64 compiler: gcc v: 12.1.0
    parameters: BOOT_IMAGE=/@/boot/vmlinuz-linux-mainline
    root=UUID=a55c4a54-0d20-415e-93d9-23fd6938b438 rw rootflags=subvol=@ splash
    rd.udev.log_priority=3 vt.global_cursor_default=0
    resume=UUID=f2faf51c-db74-457c-bb9d-eaf707594e6f loglevel=3 ibt=off
  Desktop: KDE Plasma v: 5.25.3 tk: Qt v: 5.15.5 wm: kwin_x11 vt: 1 dm: SDDM
    Distro: Garuda Linux base: Arch Linux
Machine:
  Type: Convertible System: ASUSTeK product: ZenBook UX564EH_Q528EH v: 1.0
    serial: <superuser required>
  Mobo: ASUSTeK model: UX564EH v: 1.0 serial: <superuser required>
    UEFI: American Megatrends LLC. v: UX564EH.312 date: 03/09/2022
Battery:
  ID-1: BAT0 charge: 73.1 Wh (80.8%) condition: 90.5/96.0 Wh (94.3%) volts: 11.7 min: 11.7
    model: ASUSTeK ASUS Battery type: Li-ion serial: N/A status: discharging cycles: 4
  Device-1: hid-0018:04F3:2C26.0001-battery model: ELAN9009:00 04F3:2C26 serial: N/A charge: N/A
    status: N/A
CPU:
  Info: model: 11th Gen Intel Core i7-1165G7 bits: 64 type: MT MCP arch: Tiger Lake built: 2020
    process: Intel 10nm family: 6 model-id: 0x8C (140) stepping: 1 microcode: 0xA4
  Topology: cpus: 1x cores: 4 tpc: 2 threads: 8 smt: enabled cache: L1: 320 KiB
    desc: d-4x48 KiB; i-4x32 KiB L2: 5 MiB desc: 4x1.2 MiB L3: 12 MiB desc: 1x12 MiB
  Speed (MHz): avg: 2588 high: 4689 min/max: 400/4700 scaling: driver: intel_pstate
    governor: powersave cores: 1: 4689 2: 965 3: 2800 4: 2800 5: 2800 6: 1056 7: 2800 8: 2800
    bogomips: 44864
  Flags: avx avx2 ht lm nx pae sse sse2 sse3 sse4_1 sse4_2 ssse3 vmx
  Vulnerabilities:
  Type: itlb_multihit status: Not affected
  Type: l1tf status: Not affected
  Type: mds status: Not affected
  Type: meltdown status: Not affected
  Type: mmio_stale_data status: Not affected
  Type: spec_store_bypass mitigation: Speculative Store Bypass disabled via prctl
  Type: spectre_v1 mitigation: usercopy/swapgs barriers and __user pointer sanitization
  Type: spectre_v2 mitigation: Enhanced IBRS, IBPB: conditional, RSB filling
  Type: srbds status: Not affected
  Type: tsx_async_abort status: Not affected
Graphics:
  Device-1: Intel TigerLake-LP GT2 [Iris Xe Graphics] vendor: ASUSTeK driver: i915 v: kernel
    arch: Gen12.1 process: Intel 10nm built: 2020-21 ports: active: HDMI-A-1,eDP-1 empty: DP-1,DP-2
    bus-ID: 00:02.0 chip-ID: 8086:9a49 class-ID: 0300
  Device-2: NVIDIA TU117M vendor: ASUSTeK driver: nvidia v: 515.57 alternate: nouveau,nvidia_drm
    non-free: 515.xx+ status: current (as of 2022-06) arch: Turing process: TSMC 12nm built: 2018-22
    pcie: gen: 3 speed: 8 GT/s lanes: 4 link-max: lanes: 16 bus-ID: 58:00.0 chip-ID: 10de:1f99
    class-ID: 0302
  Device-3: IMC Networks USB2.0 HD UVC WebCam type: USB driver: uvcvideo bus-ID: 3-5:3
    chip-ID: 13d3:56eb class-ID: fe01 serial: <filter>
  Display: x11 server: X.Org v: 21.1.4 with: Xwayland v: 22.1.3 compositor: kwin_x11 driver: X:
    loaded: modesetting,nvidia gpu: i915 display-ID: :0 screens: 1
  Screen-1: 0 s-res: 3840x1080 s-dpi: 96 s-size: 1016x285mm (40.00x11.22")
    s-diag: 1055mm (41.54")
  Monitor-1: HDMI-A-1 mapped: HDMI-1 pos: right model: Philips PHL 246E9Q serial: <filter>
    built: 2022 res: 1920x1080 hz: 60 dpi: 93 gamma: 1.2 size: 527x296mm (20.75x11.65")
    diag: 604mm (23.8") ratio: 16:9 modes: max: 1920x1080 min: 720x400
  Monitor-2: eDP-1 pos: primary,left model: BOE Display 0x07d8 built: 2018 res: 1920x1080 hz: 60
    dpi: 142 gamma: 1.2 size: 344x194mm (13.54x7.64") diag: 395mm (15.5") ratio: 16:9
    modes: 1920x1080
  OpenGL: renderer: Mesa Intel Xe Graphics (TGL GT2) v: 4.6 Mesa 22.1.3 direct render: Yes
Audio:
  Device-1: Intel Tiger Lake-LP Smart Sound Audio vendor: ASUSTeK driver: sof-audio-pci-intel-tgl
    alternate: snd_hda_intel,snd_sof_pci_intel_tgl bus-ID: 3-2.4.1:6 bus-ID: 00:1f.3
    chip-ID: 046d:0a8f chip-ID: 8086:a0c8 class-ID: 0300 class-ID: 0401
  Device-2: Logitech H390 headset with microphone type: USB
    driver: hid-generic,snd-usb-audio,usbhid
  Sound Server-1: ALSA v: k5.19.
0-rc6-1-mainline running: yes
  Sound Server-2: sndio v: N/A running: no
  Sound Server-3: PulseAudio v: 16.1 running: no
  Sound Server-4: PipeWire v: 0.3.55 running: yes
Network:
  Device-1: Intel Wi-Fi 6 AX201 driver: iwlwifi v: kernel bus-ID: 00:14.3 chip-ID: 8086:a0f0
    class-ID: 0280
  IF: wlo1 state: down mac: <filter>
  Device-2: TP-Link UE300 10/100/1000 LAN (ethernet mode) [Realtek RTL8153] type: USB
    driver: r8152 bus-ID: 4-2.3:3 chip-ID: 2357:0601 class-ID: 0000 serial: <filter>
  IF: enp0s20f0u2u3 state: up speed: 1000 Mbps duplex: full mac: <filter>
Bluetooth:
  Device-1: Intel AX201 Bluetooth type: USB driver: btusb v: 0.8 bus-ID: 3-10:7 chip-ID: 8087:0026
    class-ID: e001
  Report: bt-adapter ID: hci0 rfk-id: 3 state: up address: <filter>
Drives:
  Local Storage: total: 504.19 GiB used: 82.64 GiB (16.4%)
  SMART Message: Unable to run smartctl. Root privileges required.
  ID-1: /dev/nvme0n1 maj-min: 259:0 vendor: Intel model: HBRPEKNX0202A size: 476.94 GiB
    block-size: physical: 512 B logical: 512 B speed: 15.8 Gb/s lanes: 2 type: SSD serial: <filter>
    rev: G002 temp: 35.9 C scheme: GPT
  ID-2: /dev/nvme1n1 maj-min: 259:4 vendor: Intel model: HBRPEKNX0202AO size: 27.25 GiB
    block-size: physical: 512 B logical: 512 B speed: 15.8 Gb/s lanes: 2 type: SSD serial: <filter>
    rev: K5110440 temp: 49.9 C scheme: GPT
Partition:
  ID-1: / raw-size: 459.78 GiB size: 459.78 GiB (100.00%) used: 82.64 GiB (18.0%) fs: btrfs
    dev: /dev/nvme0n1p2 maj-min: 259:2
  ID-2: /boot/efi raw-size: 300 MiB size: 299.4 MiB (99.80%) used: 576 KiB (0.2%) fs: vfat
    dev: /dev/nvme0n1p1 maj-min: 259:1
  ID-3: /home raw-size: 459.78 GiB size: 459.78 GiB (100.00%) used: 82.64 GiB (18.0%) fs: btrfs
    dev: /dev/nvme0n1p2 maj-min: 259:2
  ID-4: /var/log raw-size: 459.78 GiB size: 459.78 GiB (100.00%) used: 82.64 GiB (18.0%)
    fs: btrfs dev: /dev/nvme0n1p2 maj-min: 259:2
  ID-5: /var/tmp raw-size: 459.78 GiB size: 459.78 GiB (100.00%) used: 82.64 GiB (18.0%)
    fs: btrfs dev: /dev/nvme0n1p2 maj-min: 259:2
Swap:
  Kernel: swappiness: 133 (default 60) cache-pressure: 100 (default)
  ID-1: swap-1 type: zram size: 15.33 GiB used: 0 KiB (0.0%) priority: 100 dev: /dev/zram0
  ID-2: swap-2 type: partition size: 16.86 GiB used: 0 KiB (0.0%) priority: -2
    dev: /dev/nvme0n1p3 maj-min: 259:3
Sensors:
  System Temperatures: cpu: 67.0 C mobo: N/A
  Fan Speeds (RPM): cpu: 3200
Info:
  Processes: 275 Uptime: 8m wakeups: 357 Memory: 15.33 GiB used: 2.47 GiB (16.1%) Init: systemd
  v: 251 default: graphical tool: systemctl Compilers: gcc: 12.1.0 clang: 14.0.6 Packages:
  pacman: 1621 lib: 360 Client: shell wrapper v: 5.1.16-release inxi: 3.3.19
Garuda (2.6.5-1):
  System install date:     2022-05-15
  Last full system update: 2022-07-13
  Is partially upgraded:   No
  Relevant software:       NetworkManager
  Windows dual boot:       No/Undetected
  Snapshots:               Snapper
  Failed units:
Here is an excerpt of the journal after I started the console and ended up with a black screen:
Jul 13 15:55:19 jim-zbf15 kwin_x11[1412]: qt.qpa.xcb: QXcbConnection: XCB error: 3 (BadWindow), sequence: 62618, resource id: 31457741, major code: 18 (ChangeProperty), minor code: 0
Jul 13 15:55:19 jim-zbf15 systemd[1328]: Started Konsole - Terminal.
Jul 13 15:55:19 jim-zbf15 plasmashell[1484]: file:///usr/share/plasma/plasmoids/org.kde.plasma.taskmanager/contents/ui/Task.qml:385: Unable to assign [undefined] to QString
Jul 13 15:55:20 jim-zbf15 kwin_x11[1412]: qt.qpa.xcb: QXcbConnection: XCB error: 3 (BadWindow), sequence: 63095, resource id: 17041308, major code: 3 (GetWindowAttributes), minor code: 0
Jul 13 15:55:20 jim-zbf15 kwin_x11[1412]: qt.qpa.xcb: QXcbConnection: XCB error: 9 (BadDrawable), sequence: 63096, resource id: 17041308, major code: 14 (GetGeometry), minor code: 0
Jul 13 15:55:22 jim-zbf15 sudo[17682]:    jimbo : a password is required ; TTY=pts/1 ; PWD=/home/jimbo ; USER=root ; COMMAND=/usr/bin/true
Jul 13 15:55:46 jim-zbf15 dbus-daemon[472]: [system] Activating via systemd: service name='org.freedesktop.home1' unit='dbus-org.freedesktop.home1.service' requested by ':1.426' (uid=0 pid=17725 comm="sudo journalctl -b")
Jul 13 15:55:46 jim-zbf15 dbus-daemon[472]: [system] Activation via systemd failed for unit 'dbus-org.freedesktop.home1.service': Unit dbus-org.freedesktop.home1.service not found.
Jul 13 15:55:46 jim-zbf15 sudo[17725]: pam_systemd_home(sudo:auth): systemd-homed is not available: Unit dbus-org.freedesktop.home1.service not found.
Jul 13 15:55:51 jim-zbf15 audit[17725]: USER_AUTH pid=17725 uid=1000 auid=1000 ses=3 msg='op=PAM:authentication grantors=pam_faillock,pam_permit,pam_faillock acct="jimbo" exe="/usr/bin/sudo" hostname=? addr=? terminal=/dev/pts/1 res=success'
Jul 13 15:55:51 jim-zbf15 audit[17725]: USER_ACCT pid=17725 uid=1000 auid=1000 ses=3 msg='op=PAM:accounting grantors=pam_unix,pam_permit,pam_time acct="jimbo" exe="/usr/bin/sudo" hostname=? addr=? terminal=/dev/pts/1 res=success'
Jul 13 15:55:51 jim-zbf15 audit[17725]: CRED_REFR pid=17725 uid=1000 auid=1000 ses=3 msg='op=PAM:setcred grantors=pam_faillock,pam_permit,pam_faillock acct="root" exe="/usr/bin/sudo" hostname=? addr=? terminal=/dev/pts/1 res=success'
Jul 13 15:55:51 jim-zbf15 sudo[17725]:    jimbo : TTY=pts/1 ; PWD=/home/jimbo ; USER=root ; COMMAND=/usr/bin/journalctl -b
Jul 13 15:55:51 jim-zbf15 kernel: audit: type=1100 audit(1657742151.165:171): pid=17725 uid=1000 auid=1000 ses=3 msg='op=PAM:authentication grantors=pam_faillock,pam_permit,pam_faillock acct="jimbo" exe="/usr/bin/sudo" hostname=? addr=? terminal=/dev/pts/1 res=success'
Jul 13 15:55:51 jim-zbf15 kernel: audit: type=1101 audit(1657742151.165:172): pid=17725 uid=1000 auid=1000 ses=3 msg='op=PAM:accounting grantors=pam_unix,pam_permit,pam_time acct="jimbo" exe="/usr/bin/sudo" hostname=? addr=? terminal=/dev/pts/1 res=success'
Jul 13 15:55:51 jim-zbf15 kernel: audit: type=1110 audit(1657742151.165:173): pid=17725 uid=1000 auid=1000 ses=3 msg='op=PAM:setcred grantors=pam_faillock,pam_permit,pam_faillock acct="root" exe="/usr/bin/sudo" hostname=? addr=? terminal=/dev/pts/1 res=success'
Jul 13 15:55:51 jim-zbf15 sudo[17725]: pam_unix(sudo:session): session opened for user root(uid=0) by jimbo(uid=1000)
Jul 13 15:55:51 jim-zbf15 audit[17725]: USER_START pid=17725 uid=1000 auid=1000 ses=3 msg='op=PAM:session_open grantors=pam_systemd_home,pam_limits,pam_unix,pam_permit acct="root" exe="/usr/bin/sudo" hostname=? addr=? terminal=/dev/pts/1 res=success'
Jul 13 15:55:51 jim-zbf15 kernel: audit: type=1105 audit(1657742151.168:174): pid=17725 uid=1000 auid=1000 ses=3 msg='op=PAM:session_open grantors=pam_systemd_home,pam_limits,pam_unix,pam_permit acct="root" exe="/usr/bin/sudo" hostname=? addr=? terminal=/dev/pts/1 res=success'