Hello! I’ve been having some issues with my Garuda Partition on my new laptop! I haven’t had this problem on my other installations, so I’m guessing maybe it’s because I’m dual-booting or because the specs are newer.
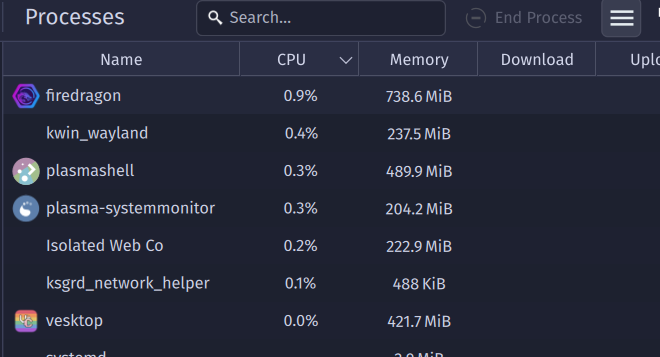
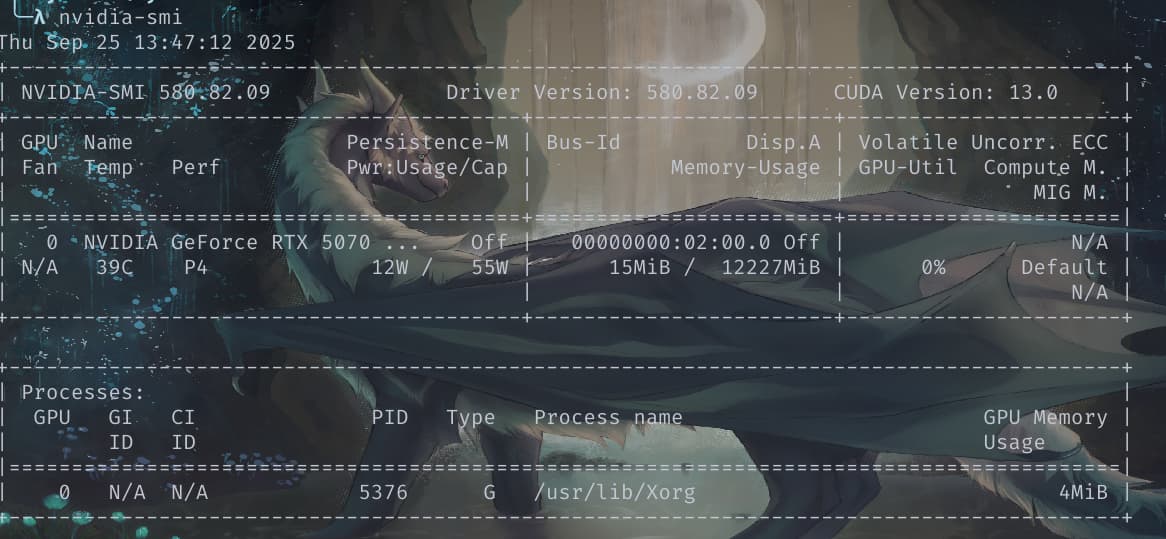
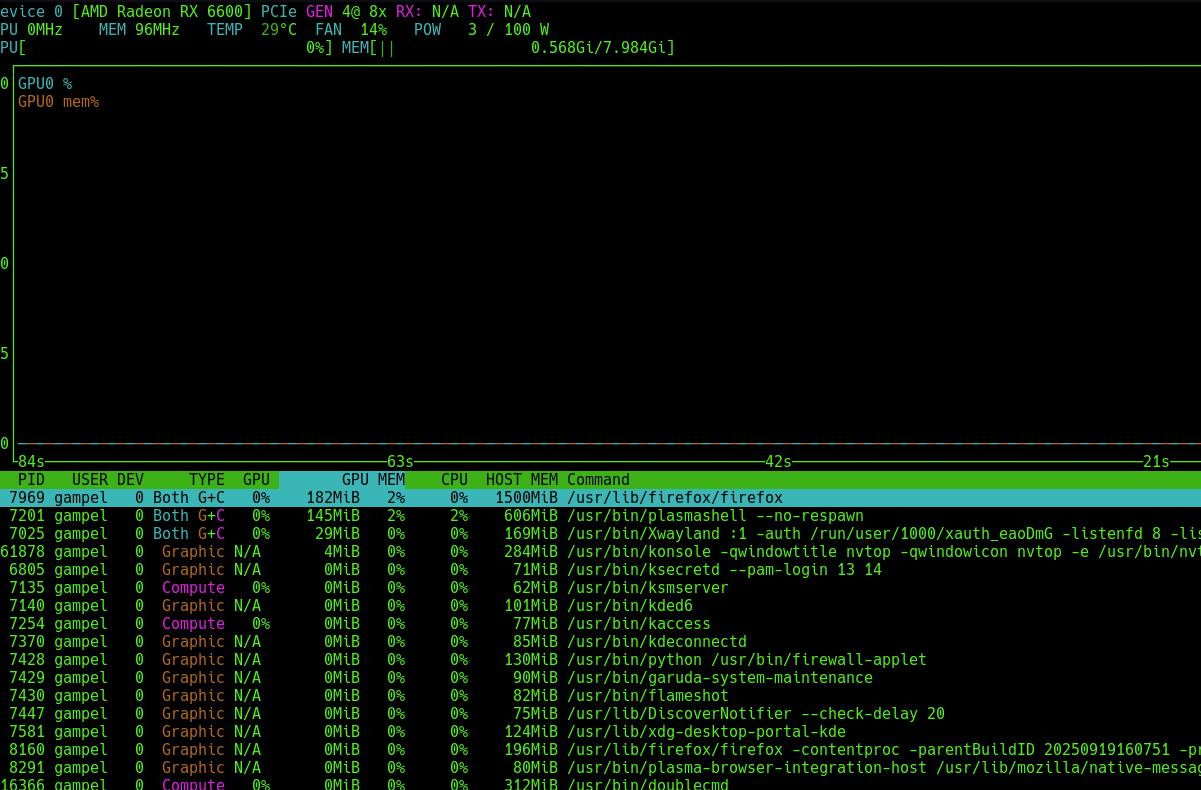
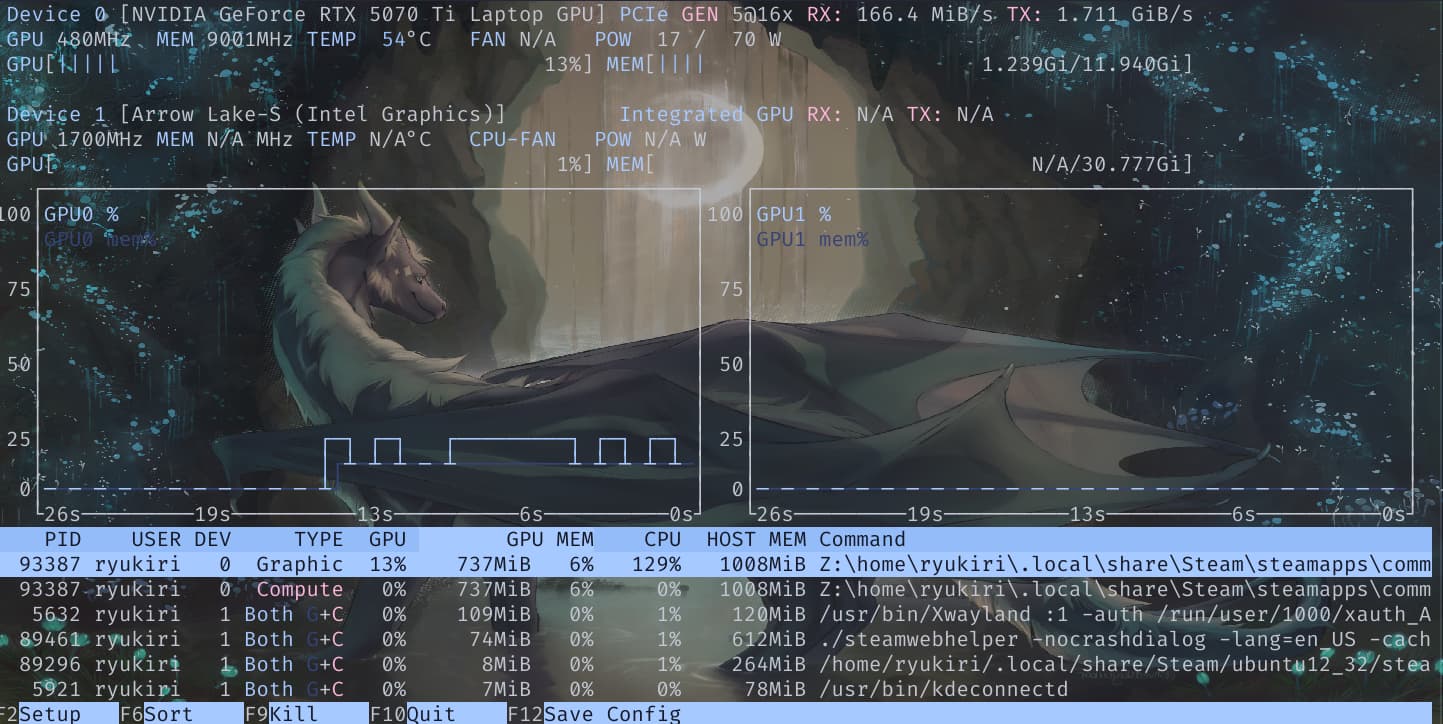
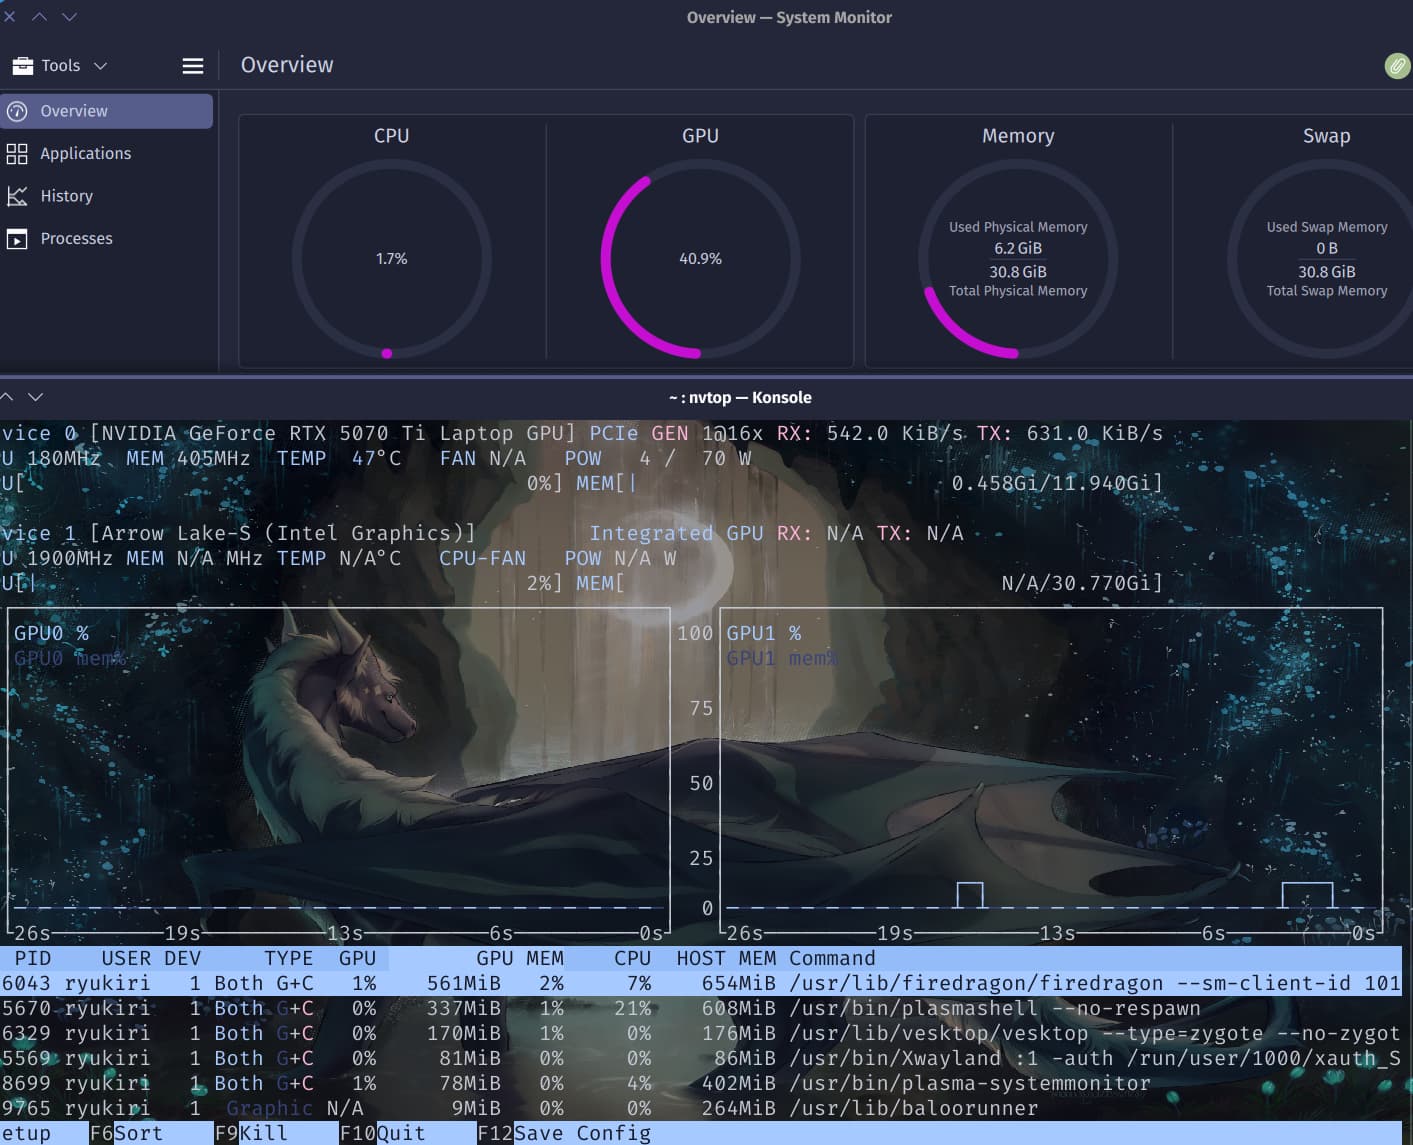
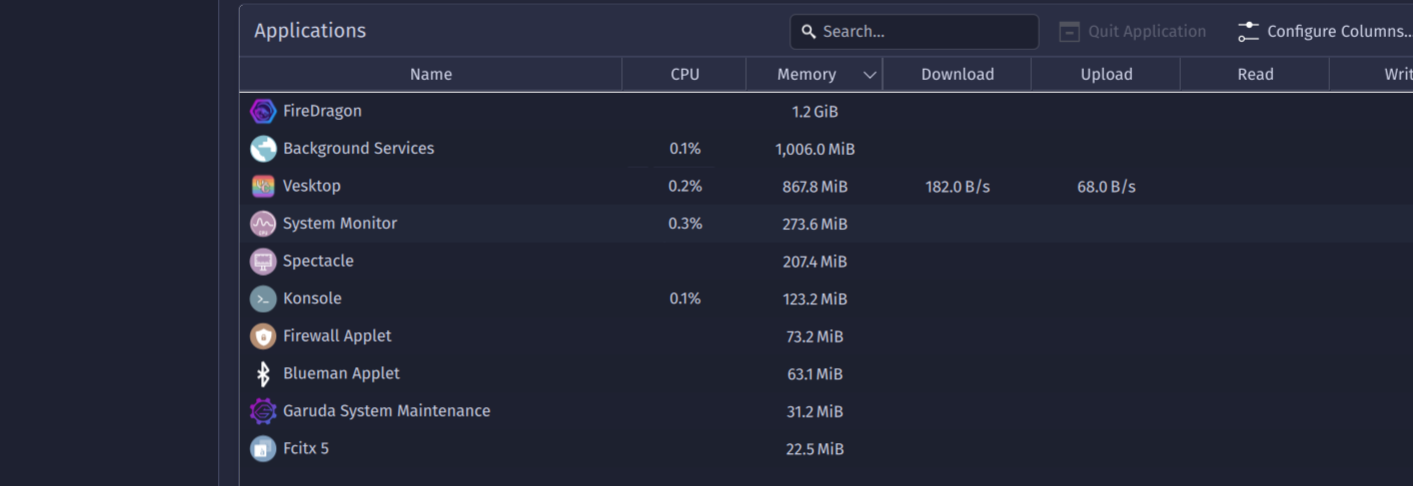
My GPU usage sometimes shoots to 99% when I’m not running anything computational (Sometimes it pops up when I just have firedragon and discord open along with aseprirte). It definitely should NOT have a 99% usage.
I’ve tried reinstalling nividia dkms, swtiching to different kernels just in case (mainly use zen), I tried some other things too but I honestly forgot what else I did!
I would appreciate some pointers on what I can do to fix this, because I really love garuda and it does make me sad to have to boot up my windows partition lol
System:
Kernel: 6.17.0-rc6-1-mainline arch: x86_64 bits: 64 compiler: gcc v: 15.2.1
clocksource: tsc avail: acpi_pm
parameters: BOOT_IMAGE=/@/boot/vmlinuz-linux-mainline
root=UUID=69010859-42b5-4d66-9530-0424b1b3a1ac rw rootflags=subvol=@
loglevel=3 quiet
Desktop: KDE Plasma v: 6.4.5 tk: Qt v: N/A info: frameworks v: 6.18.0
wm: kwin_wayland tools: avail: hypridle,hyprlock vt: 1 dm: SDDM
Distro: Garuda base: Arch Linux
Machine:
Type: Laptop System: LENOVO product: 83LU v: Legion Pro 5 16IAX10H
serial: <superuser required> Chassis: type: 10 v: Legion Pro 5 16IAX10H
serial: <superuser required>
Mobo: LENOVO model: LNVNB161216 v: SDK0T76461 WIN
serial: <superuser required> part-nu: LENOVO_MT_83LU_BU_idea_FM_Legion Pro
5 16IAX10H uuid: <superuser required> UEFI: LENOVO v: Q6CN26WW
date: 05/01/2025
Battery:
ID-1: BAT0 charge: 85.6 Wh (98%) condition: 87.3/80 Wh (109.1%) volts: 16.67
min: 15.52 model: ATL L24N4PC0 type: Li-poly serial: <filter> charging:
status: full type: standard avail: long_life,standard cycles: 2
CPU:
Info: model: Intel Core Ultra 9 275HX bits: 64 type: MCP arch: Arrow Lake
level: v3 note: check built: 2024+ process: Intel 20a (2nm) family: 6
model-id: 0xC6 (198) stepping: 2 microcode: 0x119
Topology: cpus: 1x dies: 1 clusters: 12 cores: 24 smt: <unsupported>
cache: L1: 2.4 MiB desc: d-16x32 KiB, 8x48 KiB; i-24x64 KiB L2: 40 MiB
desc: 8x3 MiB, 4x4 MiB L3: 36 MiB desc: 1x36 MiB
Speed (MHz): avg: 1873 min/max: 800/5300:5400:4700 scaling:
driver: intel_pstate governor: performance cores: 1: 1873 2: 1873 3: 1873
4: 1873 5: 1873 6: 1873 7: 1873 8: 1873 9: 1873 10: 1873 11: 1873 12: 1873
13: 1873 14: 1873 15: 1873 16: 1873 17: 1873 18: 1873 19: 1873 20: 1873
21: 1873 22: 1873 23: 1873 24: 1873 bogomips: 147456
Flags-basic: avx avx2 ht lm nx pae sse sse2 sse3 sse4_1 sse4_2 ssse3 vmx
Vulnerabilities: <filter>
Graphics:
Device-1: Intel Arrow Lake-S [Intel Graphics] vendor: Lenovo driver: i915
v: kernel alternate: xe arch: Xe2-LPG process: TSMC n3 (3nm) built: 2025+
ports: active: eDP-2 empty: DP-2,DP-3 bus-ID: 00:02.0 chip-ID: 8086:7d67
class-ID: 0300
Device-2: NVIDIA GB205M [GeForce RTX 5070 Ti Mobile] vendor: Lenovo
driver: nvidia v: 580.82.09 alternate: nouveau,nvidia_drm
non-free: 550-580.xx+ status: current (as of 2025-08) arch: Lovelace
code: AD1xx process: TSMC n4 (5nm) built: 2022+ pcie: gen: 1
speed: 2.5 GT/s lanes: 16 link-max: gen: 5 speed: 32 GT/s ports:
active: none empty: DP-1,HDMI-A-1,eDP-1 bus-ID: 02:00.0 chip-ID: 10de:2f58
class-ID: 0300
Device-3: Bison Integrated Camera driver: uvcvideo type: USB rev: 2.0
speed: 480 Mb/s lanes: 1 mode: 2.0 bus-ID: 3-11:6 chip-ID: 5986:11ad
class-ID: fe01 serial: <filter>
Display: wayland server: X.org v: 1.21.1.18 with: Xwayland v: 24.1.8
compositor: kwin_wayland driver: X: loaded: modesetting,nvidia
unloaded: nouveau,vesa alternate: fbdev,intel,nv dri: iris gpu: i915
display-ID: 0
Monitor-1: eDP-2 model: Samsung ATNA60HU01-0 built: 2024 res:
mode: 2560x1600 hz: 240 scale: 125% (1.25) to: 2048x1280 dpi: 191 gamma: 1.2
size: 340x220mm (13.39x8.66") diag: 405mm (15.94") modes: 2560x1600
API: EGL v: 1.5 hw: drv: intel iris drv: nvidia platforms: device: 0
drv: nvidia device: 1 drv: iris device: 3 drv: swrast gbm: drv: iris
surfaceless: drv: nvidia wayland: drv: iris x11: drv: iris
inactive: device-2
API: OpenGL v: 4.6.0 compat-v: 4.5 vendor: intel mesa v: 25.2.3-arch1.2
glx-v: 1.4 direct-render: yes renderer: Mesa Intel Graphics (ARL)
device-ID: 8086:7d67 memory: 30.05 GiB unified: yes display-ID: :1.0
API: Vulkan v: 1.4.321 layers: 15 device: 0 type: integrated-gpu
name: Intel Graphics (ARL) driver: mesa intel v: 25.2.3-arch1.2
device-ID: 8086:7d67 surfaces: N/A device: 1 type: discrete-gpu
name: NVIDIA GeForce RTX 5070 Ti Laptop GPU driver: nvidia v: 580.82.09
device-ID: 10de:2f58 surfaces: N/A device: 2 type: cpu name: llvmpipe
(LLVM 20.1.8 256 bits) driver: mesa llvmpipe v: 25.2.3-arch1.2 (LLVM
20.1.8) device-ID: 10005:0000 surfaces: N/A
Info: Tools: api: clinfo, eglinfo, glxinfo, vulkaninfo
de: kscreen-console,kscreen-doctor gpu: corectrl, nvidia-settings,
nvidia-smi wl: wayland-info x11: xdriinfo, xdpyinfo, xprop, xrandr
Audio:
Device-1: NVIDIA driver: snd_hda_intel v: kernel pcie: gen: 5 speed: 32 GT/s
lanes: 16 bus-ID: 02:00.1 chip-ID: 10de:2f80 class-ID: 0403
Device-2: Intel vendor: Lenovo driver: snd_hda_intel v: kernel
alternate: snd_sof_pci_intel_mtl bus-ID: 80:1f.3 chip-ID: 8086:7f50
class-ID: 0401
Device-3: Logitech Blue Microphones
driver: hid-generic,snd-usb-audio,usbhid type: USB rev: 2.0 speed: 480 Mb/s
lanes: 1 mode: 2.0 bus-ID: 3-10:5 chip-ID: 046d:0ab7 class-ID: 0300
serial: <filter>
API: ALSA v: k6.17.0-rc6-1-mainline status: kernel-api with: aoss
type: oss-emulator tools: N/A
Server-1: sndiod v: N/A status: off tools: aucat,midicat,sndioctl
Server-2: PipeWire v: 1.4.8 status: active with: 1: pipewire-pulse
status: active 2: wireplumber status: active 3: pipewire-alsa type: plugin
4: pw-jack type: plugin tools: pactl,pw-cat,pw-cli,wpctl
Network:
Device-1: Realtek RTL8111/8168/8211/8411 PCI Express Gigabit Ethernet
vendor: Lenovo driver: r8169 v: kernel pcie: gen: 1 speed: 2.5 GT/s lanes: 1
port: 3000 bus-ID: 81:00.0 chip-ID: 10ec:8168 class-ID: 0200
IF: enp129s0 state: down mac: <filter>
Device-2: MEDIATEK vendor: Lenovo driver: mt7925e v: kernel pcie: gen: 2
speed: 5 GT/s lanes: 1 port: N/A bus-ID: 82:00.0 chip-ID: 14c3:7925
class-ID: 0280
IF: wlp130s0 state: up mac: <filter>
Info: services: NetworkManager, smbd, systemd-timesyncd, wpa_supplicant
Bluetooth:
Device-1: Foxconn / Hon Hai Wireless_Device driver: btusb v: 0.8 type: USB
rev: 2.1 speed: 480 Mb/s lanes: 1 mode: 2.0 bus-ID: 3-14:7
chip-ID: 0489:e111 class-ID: e001 serial: <filter>
Report: btmgmt ID: hci1 rfk-id: 4 state: down bt-service: enabled,running
rfk-block: hardware: no software: yes address: <filter> bt-v: 5.4 lmp-v: 13
status: discoverable: no pairing: no
Drives:
Local Storage: total: 1.84 TiB used: 188.95 GiB (10.0%)
SMART Message: Unable to run smartctl. Root privileges required.
ID-1: /dev/nvme0n1 maj-min: 259:0 vendor: Samsung
model: MZAL81T0HFLB-00BL2 size: 953.87 GiB block-size: physical: 512 B
logical: 512 B speed: 63.2 Gb/s lanes: 4 tech: SSD serial: <filter>
fw-rev: 3L1QKXF7 temp: 43.9 C scheme: GPT
ID-2: /dev/sda maj-min: 8:0 vendor: Samsung model: PSSD T7
size: 931.51 GiB block-size: physical: 512 B logical: 512 B type: USB
rev: 3.2 spd: 10 Gb/s lanes: 1 mode: 3.2 gen-2x1 tech: SSD
serial: <filter> scheme: MBR
Partition:
ID-1: / raw-size: 683.59 GiB size: 683.59 GiB (100.00%)
used: 188.91 GiB (27.6%) fs: btrfs dev: /dev/nvme0n1p5 maj-min: 259:5
ID-2: /boot/efi raw-size: 260 MiB size: 256 MiB (98.46%)
used: 46.8 MiB (18.3%) fs: vfat dev: /dev/nvme0n1p1 maj-min: 259:1
ID-3: /home raw-size: 683.59 GiB size: 683.59 GiB (100.00%)
used: 188.91 GiB (27.6%) fs: btrfs dev: /dev/nvme0n1p5 maj-min: 259:5
ID-4: /var/log raw-size: 683.59 GiB size: 683.59 GiB (100.00%)
used: 188.91 GiB (27.6%) fs: btrfs dev: /dev/nvme0n1p5 maj-min: 259:5
ID-5: /var/tmp raw-size: 683.59 GiB size: 683.59 GiB (100.00%)
used: 188.91 GiB (27.6%) fs: btrfs dev: /dev/nvme0n1p5 maj-min: 259:5
Swap:
Kernel: swappiness: 133 (default 60) cache-pressure: 100 (default) zswap: no
ID-1: swap-1 type: zram size: 30.77 GiB used: 0 KiB (0.0%) priority: 100
comp: zstd avail: lzo-rle,lzo,lz4,lz4hc,deflate,842 dev: /dev/zram0
Sensors:
System Temperatures: cpu: 53.2 C mobo: N/A
Fan Speeds (rpm): N/A
Info:
Memory: total: 32 GiB note: est. available: 30.77 GiB used: 7.67 GiB (24.9%)
Processes: 520 Power: uptime: 10m states: freeze,mem,disk suspend: deep
avail: s2idle wakeups: 0 hibernate: platform avail: shutdown, reboot,
suspend, test_resume image: 12.25 GiB services: org_kde_powerdevil,
power-profiles-daemon, upowerd Init: systemd v: 258 default: graphical
tool: systemctl
Packages: pm: pacman pkgs: 2184 libs: 577 tools: octopi,paru Compilers:
clang: 20.1.8 gcc: 15.2.1 Shell: Bash v: 5.3.3 default: fish v: 4.0.8
running-in: konsole inxi: 3.3.39
Garuda (2.8.3-2):
System install date:     2025-08-27
Garuda release:          250826
Last full system update: 2025-09-23 ↻
Is partially upgraded:   No
Relevant software:       snapper NetworkManager dracut
Windows dual boot:       Probably (Run as root to verify)
Failed units: