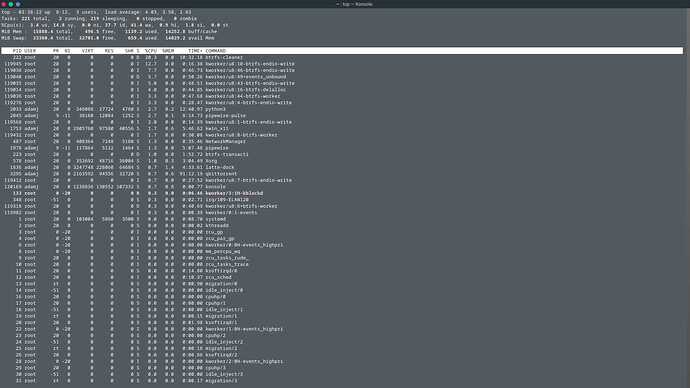
Been having a very smooth experience on Garuda for the past few days or so but just now I have noticed my system is very slow and unresponsive and laggy and it shows under the command "top" that btrfs-cleaner along with other btrfs services are eating up a lot of my CPU resources. Any clue why this is? I will reboot to see if that helps but would be good to know what causes this and if I can prevent this in the future. Thanks
λ inxi -Faz
System:
Kernel: 5.16.2-3-cachyos x86_64 bits: 64 compiler: gcc v: 11.1.0
parameters: BOOT_IMAGE=/@/boot/vmlinuz-linux-cachyos
root=UUID=95b636ca-42a5-47b4-9b7a-038581af6cdf rw rootflags=subvol=@
quiet splash rd.udev.log_priority=3 vt.global_cursor_default=0
resume=UUID=41193397-191d-45b5-8c2b-405cf71e73b2 loglevel=3
Desktop: KDE Plasma 5.23.5 tk: Qt 5.15.2 info: latte-dock wm: kwin_x11
vt: 1 dm: SDDM Distro: Garuda Linux base: Arch Linux
Machine:
Type: Laptop System: ASUSTeK product: X510UA v: 1.0
serial: <superuser required>
Mobo: ASUSTeK model: X510UA v: 1.0 serial: <superuser required>
UEFI: American Megatrends v: X510UA.312 date: 04/29/2020
Battery:
ID-1: BAT0 charge: 13.1 Wh (46.8%) condition: 28.0/42.1 Wh (66.6%)
volts: 11.5 min: 11.5 model: ASUSTeK ASUS Battery type: Li-ion serial: N/A
status: Charging cycles: 430
CPU:
Info: model: Intel Core i7-7500U bits: 64 type: MT MCP
arch: Amber/Kaby Lake note: check family: 6 model-id: 0x8E (142)
stepping: 9 microcode: 0xEA
Topology: cpus: 1x cores: 2 tpc: 2 threads: 4 smt: enabled cache:
L1: 128 KiB desc: d-2x32 KiB; i-2x32 KiB L2: 512 KiB desc: 2x256 KiB
L3: 4 MiB desc: 1x4 MiB
Speed (MHz): avg: 2996 high: 3080 min/max: 400/3500 scaling:
driver: intel_pstate governor: performance cores: 1: 2883 2: 3015 3: 3080
4: 3008 bogomips: 23220
Flags: avx avx2 ht lm nx pae sse sse2 sse3 sse4_1 sse4_2 ssse3 vmx
Vulnerabilities:
Type: itlb_multihit status: KVM: VMX disabled
Type: l1tf
mitigation: PTE Inversion; VMX: conditional cache flushes, SMT vulnerable
Type: mds mitigation: Clear CPU buffers; SMT vulnerable
Type: meltdown mitigation: PTI
Type: spec_store_bypass
mitigation: Speculative Store Bypass disabled via prctl
Type: spectre_v1
mitigation: usercopy/swapgs barriers and __user pointer sanitization
Type: spectre_v2 mitigation: Full generic retpoline, IBPB: conditional,
IBRS_FW, STIBP: conditional, RSB filling
Type: srbds mitigation: Microcode
Type: tsx_async_abort status: Not affected
Graphics:
Device-1: Intel HD Graphics 620 vendor: ASUSTeK driver: i915 v: kernel
bus-ID: 00:02.0 chip-ID: 8086:5916 class-ID: 0300
Device-2: IMC Networks VGA UVC WebCam type: USB driver: uvcvideo
bus-ID: 1-6:2 chip-ID: 13d3:5a07 class-ID: 0e02 serial: <filter>
Display: x11 server: X.Org 1.21.1.3 compositor: kwin_x11 driver:
loaded: i915 note: n/a (using device driver) display-ID: :0 screens: 1
Screen-1: 0 s-res: 1920x1080 s-dpi: 96 s-size: 508x285mm (20.0x11.2")
s-diag: 582mm (22.9")
Monitor-1: eDP1 res: 1920x1080 hz: 60 dpi: 143
size: 340x190mm (13.4x7.5") diag: 389mm (15.3")
Message: Unable to show advanced data. Required tool glxinfo missing.
Audio:
Device-1: Intel Sunrise Point-LP HD Audio vendor: ASUSTeK
driver: snd_hda_intel v: kernel alternate: snd_soc_skl bus-ID: 00:1f.3
chip-ID: 8086:9d71 class-ID: 0403
Sound Server-1: ALSA v: k5.16.2-3-cachyos running: yes
Sound Server-2: PulseAudio v: 15.0 running: no
Sound Server-3: PipeWire v: 0.3.43 running: yes
Network:
Device-1: Intel Wireless 8265 / 8275 driver: iwlwifi v: kernel
bus-ID: 02:00.0 chip-ID: 8086:24fd class-ID: 0280
IF: wlp2s0 state: up mac: <filter>
IF-ID-1: virbr0 state: down mac: <filter>
Bluetooth:
Device-1: Intel Bluetooth wireless interface type: USB driver: btusb v: 0.8
bus-ID: 1-8:3 chip-ID: 8087:0a2b class-ID: e001
Report: bt-adapter ID: hci0 rfk-id: 7 state: down
bt-service: enabled,running rfk-block: hardware: no software: yes
address: <filter>
Drives:
Local Storage: total: 704.24 GiB used: 318.27 GiB (45.2%)
SMART Message: Unable to run smartctl. Root privileges required.
ID-1: /dev/sda maj-min: 8:0 vendor: Samsung model: SSD 870 EVO 500GB
size: 465.76 GiB block-size: physical: 512 B logical: 512 B speed: 6.0 Gb/s
type: SSD serial: <filter> rev: 1B6Q scheme: GPT
ID-2: /dev/sdb maj-min: 8:16 vendor: Micron model: 1100 MTFDDAV256TBN
size: 238.47 GiB block-size: physical: 512 B logical: 512 B speed: 6.0 Gb/s
type: SSD serial: <filter> rev: A020 scheme: GPT
Partition:
ID-1: / raw-size: 448.4 GiB size: 448.4 GiB (100.00%)
used: 318.27 GiB (71.0%) fs: btrfs dev: /dev/sda2 maj-min: 8:2
ID-2: /boot/efi raw-size: 300 MiB size: 299.4 MiB (99.80%)
used: 576 KiB (0.2%) fs: vfat dev: /dev/sda1 maj-min: 8:1
ID-3: /home raw-size: 448.4 GiB size: 448.4 GiB (100.00%)
used: 318.27 GiB (71.0%) fs: btrfs dev: /dev/sda2 maj-min: 8:2
ID-4: /var/log raw-size: 448.4 GiB size: 448.4 GiB (100.00%)
used: 318.27 GiB (71.0%) fs: btrfs dev: /dev/sda2 maj-min: 8:2
ID-5: /var/tmp raw-size: 448.4 GiB size: 448.4 GiB (100.00%)
used: 318.27 GiB (71.0%) fs: btrfs dev: /dev/sda2 maj-min: 8:2
Swap:
Kernel: swappiness: 133 (default 60) cache-pressure: 100 (default)
ID-1: swap-1 type: partition size: 17.06 GiB used: 0 KiB (0.0%)
priority: -2 dev: /dev/sda3 maj-min: 8:3
ID-2: swap-2 type: zram size: 15.52 GiB used: 574.6 MiB (3.6%)
priority: 100 dev: /dev/zram0
Sensors:
System Temperatures: cpu: 64.0 C pch: 49.5 C mobo: N/A
Fan Speeds (RPM): cpu: 4000
Info:
Processes: 236 Uptime: 8h 16m wakeups: 16 Memory: 15.52 GiB
used: 2.56 GiB (16.5%) Init: systemd v: 250 tool: systemctl Compilers:
gcc: 11.1.0 clang: 13.0.0 Packages: pacman: 1547 lib: 388 Shell: fish
v: 3.3.1 running-in: konsole inxi: 3.3.12


